Super Micro Computer Key Executives
This section highlights Super Micro Computer's key executives, including their titles and compensation details.
Find Contacts at Super Micro Computer
(Showing 0 of )
Super Micro Computer Earnings
This section highlights Super Micro Computer's earnings, including key dates, EPS, earnings reports, and earnings call transcripts.
Next Earnings Date
Last Earnings Results
Earnings Call Transcripts
| Transcript | Quarter | Year | Date | Estimated EPS | Actual EPS |
|---|---|---|---|---|---|
| Read Transcript | Q2 | 2025 | 2025-02-11 | N/A | N/A |
| Read Transcript | Q1 | 2025 | 2024-11-05 | $0.73 | $0.75 |
| Read Transcript | Q4 | 2024 | 2024-08-06 | $0.81 | $0.63 |
| Read Transcript | Q3 | 2024 | 2024-04-30 | $0.58 | $0.67 |
| Read Transcript | Q2 | 2024 | 2024-01-29 | $0.55 | $0.56 |
| Read Transcript | Q1 | 2024 | 2023-11-01 | $0.32 | $0.34 |
| Read Transcript | Q4 | 2023 | 2023-08-08 | $0.34 | $0.35 |
| Read Transcript | Q3 | 2023 | 2023-05-02 | $0.17 | $0.16 |
| Read Transcript | Q2 | 2023 | 2023-01-31 | $0.32 | $0.33 |
| Read Transcript | Q1 | 2023 | 2022-11-01 | $0.31 | $0.34 |

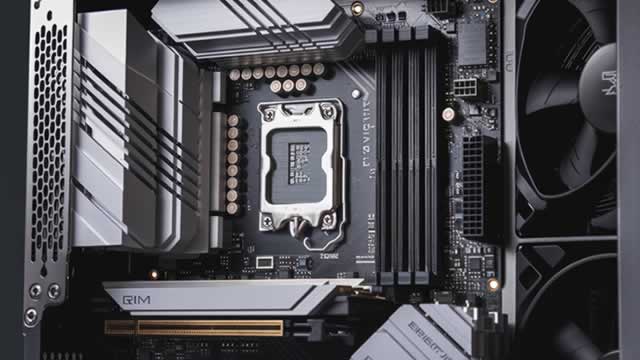
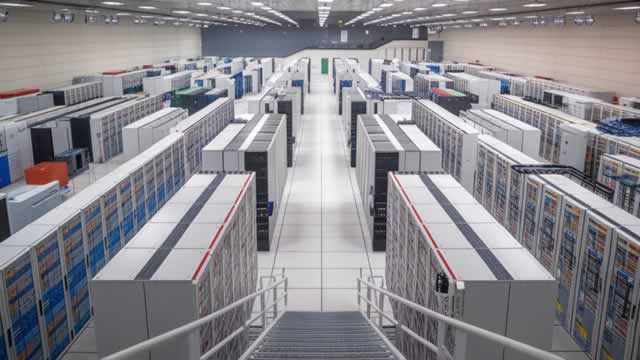
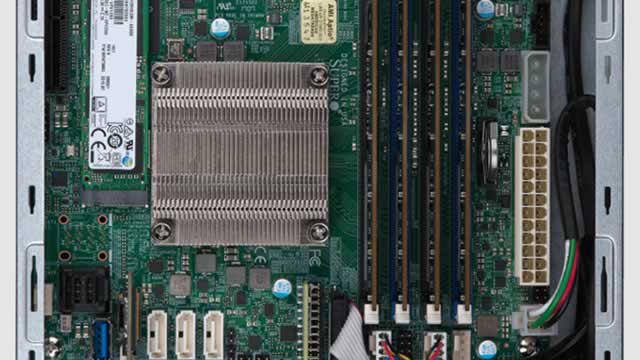
Super Micro Computer, Inc., together with its subsidiaries, develops and manufactures high performance server and storage solutions based on modular and open architecture in the United States, Europe, Asia, and internationally. Its solutions range from complete server, storage systems, modular blade servers, blades, workstations, full racks, networking devices, server sub-systems, server management software, and security software. The company provides application-optimized server solutions, rackmount and blade servers, storage, and subsystems and accessories; and server software management solutions, such as Server Management Suite, including Supermicro Server Manager, Supermicro Power Management software, Supermicro Update Manager, SuperCloud Composer, and SuperDoctor 5. In addition, it offers server subsystems and accessories comprising server boards, chassis, power supplies, and other accessories. Further, the company provides server and storage system integration, configuration, and software upgrade and update services; and technical documentation services, as well as identifies service requirements, creates and executes project plans, and conducts verification testing and technical documentation, and training services. Additionally, it offers help desk and on-site product support services for its server and storage systems; and customer support services, including ongoing maintenance and technical support for its products. The company provides its products to enterprise data centers, cloud computing, artificial intelligence, and 5G and edge computing markets. It sells its products through direct and indirect sales force, distributors, value-added resellers, system integrators, and original equipment manufacturers. The company was incorporated in 1993 and is headquartered in San Jose, California.
$34.72
Stock Price
$20.61B
Market Cap
5.68K
Employees
San Jose, CA
Location
Financial Statements
Access annual & quarterly financial statements for Super Micro Computer, including income statements, balance sheets, and cash flow statements..
Annual Income Statement
| Breakdown | June 30, 2024 | June 30, 2023 | June 30, 2022 | June 30, 2021 | June 30, 2020 |
|---|---|---|---|---|---|
| Revenue | $14.99B | $7.12B | $5.20B | $3.56B | $3.34B |
| Cost of Revenue | $12.93B | $5.84B | $4.40B | $3.02B | $2.81B |
| Gross Profit | $2.06B | $1.28B | $800.00M | $534.54M | $526.21M |
| Gross Profit Ratio | 13.80% | 18.00% | 15.40% | 15.00% | 15.76% |
| Research and Development Expenses | $463.55M | $307.26M | $272.27M | $224.37M | $221.48M |
| General and Administrative Expenses | $197.35M | $99.58M | $102.44M | $100.54M | $133.94M |
| Selling and Marketing Expenses | $189.74M | $115.03M | $90.13M | $85.68M | $85.14M |
| Selling General and Administrative Expenses | $387.09M | $214.61M | $192.56M | $186.22M | $219.08M |
| Other Expenses | $- | $3.65M | $8.08M | $-2.83M | $1.41M |
| Operating Expenses | $850.64M | $521.87M | $464.83M | $410.59M | $440.56M |
| Cost and Expenses | $13.78B | $6.36B | $4.86B | $3.43B | $3.25B |
| Interest Income | $- | $10.49M | $6.41M | $2.48M | $2.24M |
| Interest Expense | $19.35M | $10.49M | $6.41M | $2.48M | $2.24M |
| Depreciation and Amortization | $40.98M | $34.90M | $32.47M | $28.18M | $28.47M |
| EBITDA | $1.27B | $796.05M | $335.17M | $152.13M | $114.13M |
| EBITDA Ratio | 8.53% | 10.74% | 6.61% | 3.40% | 2.61% |
| Operating Income | $1.21B | $761.14M | $335.17M | $92.93M | $58.59M |
| Operating Income Ratio | 8.47% | 10.68% | 6.45% | 2.61% | 1.75% |
| Total Other Income Expenses Net | $3.37M | $-6.84M | $1.67M | $-5.32M | $-826.00K |
| Income Before Tax | $1.21B | $754.30M | $336.83M | $118.63M | $84.83M |
| Income Before Tax Ratio | 8.49% | 10.59% | 6.48% | 3.33% | 2.54% |
| Income Tax Expense | $63.29M | $110.67M | $52.88M | $6.94M | $2.92M |
| Net Income | $1.15B | $640.00M | $285.16M | $111.86M | $84.31M |
| Net Income Ratio | 8.09% | 8.98% | 5.49% | 3.14% | 2.52% |
| EPS | $2.00 | $1.21 | $0.55 | $0.22 | $0.17 |
| EPS Diluted | $1.91 | $1.14 | $0.53 | $0.21 | $0.16 |
| Weighted Average Shares Outstanding | 575.83M | 529.25M | 514.78M | 511.57M | 509.87M |
| Weighted Average Shares Outstanding Diluted | 602.15M | 559.70M | 536.15M | 535.07M | 528.38M |
| SEC Filing | Source | Source | Source | Source | Source |
| Breakdown | December 31, 2024 | September 30, 2024 | June 30, 2024 | March 31, 2024 | December 31, 2023 | September 30, 2023 | June 30, 2023 | March 31, 2023 | December 31, 2022 | September 30, 2022 | June 30, 2022 | March 31, 2022 | December 31, 2021 | September 30, 2021 | June 30, 2021 | March 31, 2021 | December 31, 2020 | September 30, 2020 | June 30, 2020 | March 31, 2020 |
|---|---|---|---|---|---|---|---|---|---|---|---|---|---|---|---|---|---|---|---|---|
| Revenue | $5.68B | $5.94B | $5.35B | $3.85B | $3.66B | $2.12B | $2.18B | $1.28B | $1.80B | $1.85B | $1.64B | $1.36B | $1.17B | $1.03B | $1.07B | $895.88M | $830.31M | $762.25M | $896.13M | $772.41M |
| Cost of Revenue | $5.01B | $5.16B | $4.81B | $3.25B | $3.10B | $1.77B | $1.81B | $1.06B | $1.47B | $1.50B | $1.35B | $1.14B | $1.01B | $894.59M | $923.47M | $772.86M | $694.21M | $632.34M | $772.61M | $639.05M |
| Gross Profit | $670.02M | $775.58M | $546.03M | $597.37M | $564.32M | $353.69M | $371.70M | $226.36M | $337.42M | $347.54M | $287.34M | $210.78M | $163.74M | $138.14M | $145.51M | $123.02M | $136.09M | $129.91M | $123.52M | $133.36M |
| Gross Profit Ratio | 11.80% | 13.10% | 10.20% | 15.50% | 15.40% | 16.70% | 17.00% | 17.60% | 18.70% | 18.80% | 17.60% | 15.50% | 14.00% | 13.40% | 13.60% | 13.70% | 16.40% | 17.00% | 13.78% | 17.27% |
| Research and Development Expenses | $158.23M | $132.24M | $127.47M | $116.23M | $108.82M | $111.03M | $84.80M | $77.52M | $70.70M | $74.24M | $70.79M | $70.87M | $65.47M | $65.14M | $58.93M | $57.91M | $52.73M | $54.80M | $66.75M | $49.59M |
| General and Administrative Expenses | $63.60M | $65.28M | $74.11M | $53.14M | $37.18M | $32.92M | $28.23M | $24.45M | $23.09M | $23.81M | $27.16M | $27.77M | $25.26M | $22.24M | $24.68M | $26.22M | $25.26M | $24.38M | $26.26M | $46.34M |
| Selling and Marketing Expenses | $79.57M | $68.85M | $55.96M | $49.69M | $46.85M | $37.23M | $31.91M | $25.31M | $28.45M | $29.36M | $24.19M | $22.36M | $21.96M | $21.62M | $22.82M | $21.83M | $20.74M | $20.29M | $21.08M | $21.89M |
| Selling General and Administrative Expenses | $143.17M | $134.14M | $130.07M | $102.83M | $84.03M | $70.15M | $60.14M | $49.76M | $51.54M | $53.17M | $51.34M | $50.13M | $47.22M | $43.87M | $47.50M | $48.05M | $46.00M | $44.67M | $47.34M | $68.23M |
| Other Expenses | $- | $- | $- | $10.04M | $-7.89M | $6.61M | $2.00M | $-78.00K | $-6.33M | $8.05M | $3.97M | $4.66M | $-607.00K | $50.00K | $-1.47M | $2.02M | $-2.54M | $-841.00K | $-700.00K | $937.00K |
| Operating Expenses | $301.40M | $266.38M | $257.54M | $219.05M | $192.86M | $181.18M | $144.94M | $127.28M | $122.24M | $127.41M | $122.13M | $121.00M | $112.69M | $109.01M | $106.43M | $105.96M | $98.73M | $99.47M | $114.09M | $117.81M |
| Cost and Expenses | $5.31B | $5.43B | $5.07B | $3.47B | $3.29B | $1.95B | $1.96B | $1.18B | $1.59B | $1.63B | $1.47B | $1.27B | $1.12B | $1.00B | $1.03B | $878.83M | $792.94M | $731.80M | $886.70M | $756.86M |
| Interest Income | $- | $- | $- | $- | $- | $50.00K | $5.55M | $166.00K | $1.19M | $3.68M | $- | $- | $- | $- | $- | $- | $- | $- | $- | $- |
| Interest Expense | $6.54M | $17.35M | $3.11M | $6.25M | $8.13M | $1.86M | $3.51M | $1.29M | $1.76M | $3.94M | $2.93M | $1.53M | $1.15M | $804.00K | $635.00K | $607.00K | $569.00K | $674.00K | $606.00K | $518.00K |
| Depreciation and Amortization | $14.88M | $14.08M | $11.81M | $10.40M | $9.62M | $9.15M | $8.97M | $8.74M | $8.65M | $8.55M | $8.42M | $8.37M | $8.13M | $7.55M | $6.88M | $6.88M | $6.91M | $7.52M | $7.50M | $7.08M |
| EBITDA | $396.47M | $530.51M | $314.25M | $398.75M | $373.20M | $188.28M | $235.73M | $107.82M | $223.83M | $228.67M | $173.63M | $98.14M | $51.05M | $36.68M | $45.96M | $23.93M | $44.27M | $37.96M | $34.43M | $22.63M |
| EBITDA Ratio | 55.02% | 65.65% | 6.73% | 10.10% | 10.14% | 8.45% | 10.47% | 7.71% | 11.58% | 12.32% | 10.34% | 6.97% | 4.30% | 2.83% | 3.52% | 2.13% | 4.19% | 3.88% | 0.97% | 2.13% |
| Operating Income | $368.62M | $509.20M | $288.49M | $378.31M | $371.46M | $172.51M | $226.75M | $73.62M | $215.18M | $220.12M | $165.21M | $89.78M | $51.05M | $29.13M | $39.08M | $17.05M | $37.37M | $30.45M | $9.43M | $15.55M |
| Operating Income Ratio | 55.02% | 65.65% | 6.47% | 9.83% | 10.14% | 8.14% | 10.38% | 5.74% | 11.93% | 11.88% | 10.10% | 6.62% | 4.35% | 2.82% | 3.66% | 1.90% | 4.50% | 3.99% | 1.05% | 2.01% |
| Total Other Income Expenses Net | $6.42M | $-10.12M | $10.84M | $3.79M | $-16.02M | $4.75M | $-1.50M | $-1.37M | $-8.09M | $4.12M | $1.04M | $3.13M | $-1.76M | $-754.00K | $-2.11M | $1.41M | $-3.11M | $-1.51M | $-1.31M | $419.00K |
| Income Before Tax | $375.05M | $499.08M | $299.33M | $382.10M | $355.45M | $177.26M | $225.25M | $97.72M | $207.09M | $224.24M | $166.26M | $92.91M | $49.29M | $28.37M | $36.98M | $18.46M | $34.26M | $28.93M | $8.12M | $15.96M |
| Income Before Tax Ratio | 55.98% | 64.35% | 6.67% | 9.92% | 9.70% | 8.36% | 10.31% | 7.61% | 11.48% | 12.11% | 10.17% | 6.85% | 4.20% | 2.75% | 3.46% | 2.06% | 4.13% | 3.80% | 0.91% | 2.07% |
| Income Tax Expense | $56.97M | $74.73M | $1.56M | $-19.98M | $61.50M | $20.21M | $31.30M | $10.86M | $29.57M | $38.93M | $25.76M | $16.19M | $7.60M | $3.33M | $-1.60M | $-227.00K | $5.11M | $3.66M | $-6.86M | $-899.00K |
| Net Income | $320.60M | $424.33M | $297.24M | $402.46M | $295.97M | $157.00M | $193.57M | $85.85M | $176.17M | $184.42M | $140.82M | $76.97M | $41.93M | $25.44M | $39.16M | $18.43M | $27.67M | $26.60M | $18.45M | $15.81M |
| Net Income Ratio | 47.85% | 54.71% | 6.64% | 10.45% | 8.08% | 7.41% | 8.86% | 6.69% | 9.77% | 9.96% | 8.61% | 5.68% | 3.58% | 2.46% | 3.66% | 2.06% | 3.33% | 3.49% | 2.06% | 2.05% |
| EPS | $0.54 | $0.72 | $0.60 | $0.71 | $0.55 | $0.30 | $0.37 | $0.16 | $0.33 | $0.35 | $0.27 | $0.15 | $0.08 | $0.05 | $0.08 | $0.04 | $0.05 | $0.05 | $0.04 | $0.03 |
| EPS Diluted | $0.51 | $0.67 | $0.55 | $0.66 | $0.51 | $0.28 | $0.34 | $0.15 | $0.31 | $0.34 | $0.26 | $0.14 | $0.08 | $0.05 | $0.07 | $0.04 | $0.05 | $0.05 | $0.03 | $0.03 |
| Weighted Average Shares Outstanding | 592.51M | 589.56M | 586.88M | 564.78M | 541.35M | 530.93M | 526.79M | 532.80M | 531.60M | 525.98M | 521.11M | 517.08M | 513.14M | 507.96M | 502.30M | 505.53M | 514.99M | 523.29M | 522.40M | 515.26M |
| Weighted Average Shares Outstanding Diluted | 636.05M | 639.15M | 642.08M | 614.31M | 580.78M | 571.85M | 565.05M | 562.33M | 561.44M | 550.17M | 542.60M | 537.86M | 535.11M | 529.16M | 527.82M | 532.18M | 535.84M | 544.26M | 542.18M | 536.93M |
| SEC Filing | Source | Source | Source | Source | Source | Source | Source | Source | Source | Source | Source | Source | Source | Source | Source | Source | Source | Source | Source | Source |
Annual Balance Sheet
| Breakdown | June 30, 2024 | June 30, 2023 | June 30, 2022 | June 30, 2021 | June 30, 2020 |
|---|---|---|---|---|---|
| Cash and Cash Equivalents | $1.67B | $440.46M | $267.40M | $232.27M | $210.53M |
| Short Term Investments | $- | $100.00K | $300.00K | $- | $- |
| Cash and Short Term Investments | $1.67B | $440.56M | $267.70M | $232.27M | $210.53M |
| Net Receivables | $2.67B | $1.15B | $834.51M | $463.83M | $403.75M |
| Inventory | $4.41B | $1.45B | $1.55B | $1.04B | $851.50M |
| Other Current Assets | $308.47M | $145.14M | $158.50M | $130.19M | $126.98M |
| Total Current Assets | $9.05B | $3.18B | $2.81B | $1.87B | $1.59B |
| Property Plant Equipment Net | $414.01M | $290.24M | $285.97M | $274.71M | $233.78M |
| Goodwill | $- | $1.80M | $- | $- | $- |
| Intangible Assets | $- | $- | $- | $- | $- |
| Goodwill and Intangible Assets | $- | $1.80M | $- | $- | $- |
| Long Term Investments | $- | $-1.80M | $5.33M | $4.58M | $2.70M |
| Tax Assets | $359.66M | $162.65M | $69.93M | $63.29M | $54.90M |
| Other Non-Current Assets | $114.95M | $42.41M | $37.53M | $32.13M | $34.50M |
| Total Non-Current Assets | $888.62M | $495.30M | $398.76M | $374.70M | $325.88M |
| Other Assets | $- | $- | $- | $- | $- |
| Total Assets | $9.94B | $3.67B | $3.21B | $2.24B | $1.92B |
| Account Payables | $1.55B | $776.83M | $655.40M | $612.34M | $417.67M |
| Short Term Debt | $402.35M | $170.12M | $456.29M | $69.81M | $30.01M |
| Tax Payables | $18.27M | $129.17M | $41.74M | $12.74M | $4.70M |
| Deferred Revenue | $- | $134.67M | $111.31M | $101.48M | $106.16M |
| Other Current Liabilities | $438.28M | $163.87M | $205.28M | $172.53M | $149.09M |
| Total Current Liabilities | $2.40B | $1.37B | $1.47B | $968.90M | $707.63M |
| Long Term Debt | $1.77B | $120.18M | $147.62M | $49.24M | $23.80M |
| Deferred Revenue Non-Current | $- | $169.78M | $122.55M | $100.84M | $97.61M |
| Deferred Tax Liabilities Non-Current | $- | $9.26M | $29.04M | $24.81M | $23.54M |
| Other Non-Current Liabilities | $297.84M | $37.95M | $39.14M | $26.59M | $23.89M |
| Total Non-Current Liabilities | $2.07B | $327.91M | $309.31M | $176.67M | $145.30M |
| Other Liabilities | $- | $- | $- | $- | $- |
| Total Liabilities | $4.47B | $1.70B | $1.78B | $1.15B | $852.94M |
| Preferred Stock | $- | $- | $- | $- | $- |
| Common Stock | $2.83B | $538.35M | $481.74M | $438.01M | $389.97M |
| Retained Earnings | $2.64B | $1.43B | $942.92M | $657.76M | $696.21M |
| Accumulated Other Comprehensive Income Loss | $706.00K | $639.00K | $911.00K | $453.00K | $-152.00K |
| Other Total Stockholders Equity | $- | $- | $- | $- | $-20.49M |
| Total Stockholders Equity | $5.47B | $1.97B | $1.43B | $1.10B | $1.07B |
| Total Equity | $5.47B | $1.97B | $1.43B | $1.10B | $1.07B |
| Total Liabilities and Stockholders Equity | $9.94B | $3.67B | $3.21B | $2.24B | $1.92B |
| Minority Interest | $164.00K | $165.00K | $172.00K | $173.00K | $167.00K |
| Total Liabilities and Total Equity | $9.94B | $3.67B | $3.21B | $2.24B | $1.92B |
| Total Investments | $- | $200.00K | $6.92M | $4.58M | $2.70M |
| Total Debt | $2.17B | $290.30M | $596.76M | $98.19M | $29.40M |
| Net Debt | $504.38M | $-150.16M | $329.37M | $-134.08M | $-181.13M |
Balance Sheet Charts
| Breakdown | December 31, 2024 | September 30, 2024 | June 30, 2024 | March 31, 2024 | December 31, 2023 | September 30, 2023 | June 30, 2023 | March 31, 2023 | December 31, 2022 | September 30, 2022 | June 30, 2022 | March 31, 2022 | December 31, 2021 | September 30, 2021 | June 30, 2021 | March 31, 2021 | December 31, 2020 | September 30, 2020 | June 30, 2020 | March 31, 2020 |
|---|---|---|---|---|---|---|---|---|---|---|---|---|---|---|---|---|---|---|---|---|
| Cash and Cash Equivalents | $1.43B | $2.09B | $1.67B | $2.12B | $725.66M | $543.16M | $440.46M | $362.80M | $304.60M | $238.27M | $267.40M | $247.42M | $247.41M | $270.05M | $232.27M | $177.89M | $315.61M | $300.09M | $210.53M | $300.86M |
| Short Term Investments | $- | $- | $- | $100.00K | $100.00K | $100.00K | $100.00K | $200.00K | $1.59M | $1.59M | $300.00K | $1.56M | $1.56M | $1.56M | $1.56M | $1.70M | $1.70M | $1.70M | $1.70M | $- |
| Cash and Short Term Investments | $1.43B | $2.09B | $1.67B | $2.12B | $725.76M | $543.26M | $440.56M | $362.80M | $304.60M | $238.27M | $267.70M | $247.42M | $247.41M | $270.05M | $232.27M | $177.89M | $315.61M | $300.09M | $210.53M | $300.86M |
| Net Receivables | $3.06B | $2.73B | $2.67B | $1.65B | $1.50B | $845.73M | $1.15B | $672.05M | $768.17M | $736.31M | $834.51M | $679.78M | $497.43M | $458.08M | $463.83M | $407.37M | $323.02M | $322.85M | $403.75M | $333.17M |
| Inventory | $3.60B | $4.93B | $4.41B | $4.12B | $2.47B | $2.05B | $1.45B | $1.54B | $1.42B | $1.74B | $1.55B | $1.59B | $1.39B | $1.18B | $1.04B | $903.90M | $807.43M | $773.86M | $851.50M | $866.23M |
| Other Current Assets | $581.41M | $100.50M | $308.47M | $173.72M | $146.73M | $129.14M | $145.14M | $139.90M | $154.92M | $169.25M | $166.78M | $162.96M | $154.78M | $124.26M | $130.19M | $150.49M | $98.21M | $82.73M | $126.98M | $148.10M |
| Total Current Assets | $8.67B | $9.85B | $9.05B | $8.06B | $4.84B | $3.57B | $3.18B | $2.72B | $2.65B | $2.88B | $2.81B | $2.68B | $2.29B | $2.04B | $1.87B | $1.64B | $1.54B | $1.48B | $1.59B | $1.65B |
| Property Plant Equipment Net | $477.49M | $451.06M | $414.01M | $385.57M | $297.10M | $291.67M | $290.24M | $290.04M | $289.25M | $290.75M | $285.97M | $282.32M | $280.28M | $284.15M | $274.71M | $265.57M | $255.41M | $241.85M | $233.78M | $230.48M |
| Goodwill | $- | $- | $- | $- | $- | $- | $1.80M | $- | $- | $- | $- | $- | $- | $- | $- | $- | $- | $- | $- | $- |
| Intangible Assets | $- | $- | $- | $- | $- | $- | $- | $- | $- | $- | $- | $- | $- | $- | $- | $- | $- | $- | $- | $- |
| Goodwill and Intangible Assets | $- | $- | $- | $- | $-509.00K | $-494.00K | $1.80M | $- | $- | $- | $- | $- | $- | $- | $- | $- | $- | $- | $- | $-1.70M |
| Long Term Investments | $- | $- | $- | $- | $509.00K | $494.00K | $-1.80M | $4.08M | $3.20M | $4.35M | $5.33M | $4.78M | $4.46M | $5.16M | $4.58M | $3.64M | $3.86M | $5.03M | $2.70M | $1.70M |
| Tax Assets | $441.25M | $411.72M | $359.66M | $330.25M | $218.27M | $185.68M | $162.65M | $148.56M | $95.74M | $89.16M | $69.93M | $66.52M | $61.84M | $63.27M | $63.29M | $57.62M | $55.78M | $55.12M | $54.90M | $45.56M |
| Other Non-Current Assets | $142.54M | $137.02M | $114.95M | $83.03M | $47.27M | $47.79M | $42.41M | $34.75M | $37.25M | $37.14M | $37.53M | $38.85M | $36.74M | $37.16M | $32.13M | $32.36M | $34.75M | $35.17M | $34.50M | $35.84M |
| Total Non-Current Assets | $1.06B | $999.80M | $888.62M | $798.85M | $562.64M | $525.13M | $495.30M | $477.43M | $425.44M | $421.40M | $398.76M | $392.46M | $383.31M | $389.74M | $374.70M | $359.19M | $349.80M | $337.17M | $325.88M | $311.88M |
| Other Assets | $- | $- | $- | $- | $- | $- | $- | $- | $- | $- | $- | $- | $- | $- | $- | $- | $- | $- | $- | $- |
| Total Assets | $9.73B | $10.85B | $9.94B | $8.86B | $5.41B | $4.10B | $3.67B | $3.19B | $3.07B | $3.30B | $3.21B | $3.07B | $2.68B | $2.43B | $2.24B | $2.00B | $1.89B | $1.82B | $1.92B | $1.96B |
| Account Payables | $549.32M | $- | $1.55B | $1.09B | $1.26B | $1.08B | $776.83M | $641.84M | $559.96M | $785.02M | $655.40M | $779.56M | $695.18M | $564.63M | $612.34M | $465.01M | $396.29M | $333.36M | $417.67M | $462.81M |
| Short Term Debt | $161.82M | $493.81M | $402.35M | $89.72M | $285.25M | $49.32M | $170.12M | $61.12M | $34.99M | $108.13M | $456.29M | $410.34M | $183.34M | $240.07M | $69.81M | $64.30M | $32.36M | $31.07M | $30.01M | $39.26M |
| Tax Payables | $115.11M | $79.71M | $18.27M | $20.02M | $46.45M | $161.40M | $129.17M | $92.60M | $38.71M | $68.41M | $41.74M | $17.41M | $14.46M | $14.27M | $12.74M | $9.62M | $10.55M | $6.33M | $4.70M | $1.98M |
| Deferred Revenue | $309.24M | $305.84M | $200.36M | $233.29M | $253.86M | $166.03M | $134.67M | $148.75M | $120.53M | $185.22M | $111.31M | $114.69M | $142.02M | $113.68M | $101.48M | $96.12M | $99.51M | $104.25M | $106.16M | $109.73M |
| Other Current Liabilities | $215.47M | $1.99B | $237.92M | $282.22M | $144.99M | $144.03M | $163.87M | $148.08M | $162.75M | $206.56M | $205.28M | $174.16M | $164.58M | $168.82M | $172.53M | $146.94M | $134.26M | $114.68M | $149.09M | $171.04M |
| Total Current Liabilities | $1.36B | $2.87B | $2.40B | $1.72B | $1.99B | $1.60B | $1.37B | $1.09B | $916.94M | $1.35B | $1.47B | $1.50B | $1.20B | $1.10B | $968.90M | $782.00M | $672.97M | $589.69M | $707.63M | $784.82M |
| Long Term Debt | $1.70B | $1.70B | $1.77B | $1.78B | $99.32M | $105.39M | $120.18M | $145.90M | $156.20M | $163.77M | $147.62M | $162.84M | $156.66M | $63.50M | $49.24M | $43.10M | $37.33M | $29.87M | $23.80M | $19.49M |
| Deferred Revenue Non-Current | $- | $- | $226.49M | $203.20M | $190.34M | $174.48M | $169.78M | $161.18M | $159.57M | $134.62M | $122.55M | $115.06M | $110.53M | $101.75M | $100.84M | $93.92M | $95.40M | $97.58M | $97.61M | $95.75M |
| Deferred Tax Liabilities Non-Current | $- | $- | $- | $-203.20M | $- | $- | $9.26M | $18.86M | $18.32M | $19.69M | $29.04M | $19.43M | $19.20M | $18.39M | $24.81M | $- | $- | $- | $- | $-19.49M |
| Other Non-Current Liabilities | $431.43M | $404.19M | $71.34M | $65.83M | $46.17M | $45.74M | $37.95M | $24.57M | $23.39M | $24.33M | $39.14M | $23.20M | $22.99M | $27.17M | $26.59M | $25.87M | $24.16M | $26.82M | $23.89M | $21.78M |
| Total Non-Current Liabilities | $2.13B | $2.10B | $2.07B | $2.05B | $335.84M | $325.60M | $327.91M | $331.65M | $339.16M | $322.73M | $309.31M | $301.10M | $290.18M | $192.42M | $176.67M | $162.90M | $156.88M | $154.26M | $145.30M | $137.02M |
| Other Liabilities | $- | $- | $- | $- | $- | $- | $- | $- | $- | $- | $- | $- | $- | $- | $- | $- | $- | $- | $- | $- |
| Total Liabilities | $3.49B | $4.97B | $4.47B | $3.77B | $2.33B | $1.93B | $1.70B | $1.42B | $1.26B | $1.68B | $1.78B | $1.80B | $1.49B | $1.29B | $1.15B | $944.89M | $829.85M | $743.95M | $852.94M | $921.84M |
| Preferred Stock | $- | $- | $- | $- | $- | $- | $- | $- | $- | $- | $- | $- | $- | $- | $- | $- | $- | $- | $- | $- |
| Common Stock | $- | $- | $2.83B | $2.81B | $1.19B | $574.72M | $538.35M | $528.28M | $514.56M | $497.18M | $481.74M | $471.09M | $460.99M | $448.98M | $438.01M | $425.49M | $410.52M | $400.16M | $389.97M | $381.12M |
| Retained Earnings | $3.33B | $3.01B | $2.64B | $2.29B | $1.89B | $1.59B | $1.43B | $1.24B | $1.30B | $1.13B | $942.92M | $802.10M | $725.13M | $683.20M | $657.76M | $627.93M | $653.13M | $722.81M | $696.21M | $677.76M |
| Accumulated Other Comprehensive Income Loss | $652.00K | $800.00K | $706.00K | $549.00K | $657.00K | $651.00K | $639.00K | $683.00K | $612.00K | $514.00K | $911.00K | $554.00K | $549.00K | $449.00K | $453.00K | $362.00K | $396.00K | $95.00K | $-152.00K | $-166.00K |
| Other Total Stockholders Equity | $2.91B | $2.87B | $- | $- | $- | $- | $- | $- | $- | $- | $- | $- | $- | $- | $- | $- | $- | $-50.49M | $-20.49M | $-20.49M |
| Total Stockholders Equity | $6.24B | $5.88B | $5.47B | $5.09B | $3.08B | $2.17B | $1.97B | $1.77B | $1.82B | $1.63B | $1.43B | $1.27B | $1.19B | $1.13B | $1.10B | $1.05B | $1.06B | $1.07B | $1.07B | $1.04B |
| Total Equity | $6.24B | $5.88B | $5.47B | $5.09B | $3.08B | $2.17B | $1.97B | $1.77B | $1.82B | $1.63B | $1.43B | $1.27B | $1.19B | $1.13B | $1.10B | $1.05B | $1.06B | $1.07B | $1.07B | $1.04B |
| Total Liabilities and Stockholders Equity | $9.73B | $10.85B | $9.94B | $8.86B | $5.41B | $4.10B | $3.67B | $3.19B | $3.07B | $3.30B | $3.21B | $3.07B | $2.68B | $2.43B | $2.24B | $2.00B | $1.89B | $1.82B | $1.92B | $1.96B |
| Minority Interest | $159.00K | $163.00K | $164.00K | $163.00K | $164.00K | $161.00K | $165.00K | $166.00K | $165.00K | $167.00K | $172.00K | $176.00K | $177.00K | $176.00K | $173.00K | $168.00K | $173.00K | $169.00K | $167.00K | $166.00K |
| Total Liabilities and Total Equity | $9.73B | $10.85B | $9.94B | $8.86B | $5.41B | $4.10B | $3.67B | $3.19B | $3.07B | $3.30B | $3.21B | $3.07B | $2.68B | $2.43B | $2.24B | $2.00B | $1.89B | $1.82B | $1.92B | $1.96B |
| Total Investments | $- | $- | $- | $100.00K | $709.00K | $127.19M | $200.00K | $4.08M | $4.79M | $5.94M | $300.00K | $6.33M | $6.01M | $6.72M | $6.13M | $5.34M | $5.56M | $6.72M | $4.40M | $1.70M |
| Total Debt | $1.86B | $2.19B | $2.17B | $1.87B | $384.57M | $146.23M | $290.30M | $187.21M | $170.14M | $249.72M | $596.76M | $547.47M | $315.94M | $278.81M | $98.19M | $85.37M | $45.50M | $36.03M | $29.40M | $33.16M |
| Net Debt | $425.62M | $104.27M | $504.38M | $-243.85M | $-341.09M | $-396.92M | $-150.16M | $-175.59M | $-134.45M | $11.46M | $329.37M | $300.04M | $68.53M | $8.76M | $-134.08M | $-92.52M | $-270.11M | $-264.06M | $-181.13M | $-267.70M |
Annual Cash Flow
| Breakdown | June 30, 2024 | June 30, 2023 | June 30, 2022 | June 30, 2021 | June 30, 2020 |
|---|---|---|---|---|---|
| Net Income | $1.15B | $640.00M | $285.16M | $111.86M | $84.31M |
| Depreciation and Amortization | $40.98M | $34.90M | $32.47M | $28.18M | $28.47M |
| Deferred Income Tax | $-168.50M | $-92.97M | $-6.82M | $-8.39M | $-13.77M |
| Stock Based Compensation | $231.51M | $54.43M | $32.82M | $28.55M | $20.19M |
| Change in Working Capital | $-3.75B | $-84.72M | $-784.10M | $-44.50M | $-164.79M |
| Accounts Receivables | $-1.59B | $-311.90M | $-371.60M | $-59.33M | $-7.02M |
| Inventory | $-2.90B | $100.04M | $-519.73M | $-196.27M | $-199.68M |
| Accounts Payables | $679.19M | $127.14M | $50.15M | $189.31M | $59.89M |
| Other Working Capital | $57.37M | $84.72M | $57.09M | $21.78M | $-17.98M |
| Other Non Cash Items | $9.99M | $111.93M | $-335.00K | $7.25M | $15.26M |
| Net Cash Provided by Operating Activities | $-2.49B | $663.58M | $-440.80M | $122.95M | $-30.33M |
| Investments in Property Plant and Equipment | $-124.28M | $-36.79M | $-45.18M | $-58.02M | $-44.34M |
| Acquisitions Net | $-296.00K | $-2.19M | $- | $- | $750.00K |
| Purchases of Investments | $-69.67M | $-500.00K | $-1.10M | $- | $- |
| Sales Maturities of Investments | $- | $500.00K | $- | $- | $750.00K |
| Other Investing Activities | $- | $-500.00K | $-1.10M | $- | $-750.00K |
| Net Cash Used for Investing Activities | $-194.25M | $-39.49M | $-46.28M | $-58.02M | $-43.59M |
| Debt Repayment | $1.88B | $-300.56M | $512.55M | $66.45M | $4.35M |
| Common Stock Issued | $2.31B | $- | $20.99M | $- | $- |
| Common Stock Repurchased | $- | $-150.00M | $-10.08M | $-130.00M | $-8.24M |
| Dividends Paid | $- | $- | $- | $- | $- |
| Other Financing Activities | $-287.01M | $2.27M | $10.32M | $19.11M | $19.45M |
| Net Cash Used Provided by Financing Activities | $3.91B | $-448.29M | $522.87M | $-44.44M | $23.80M |
| Effect of Forex Changes on Cash | $-2.19M | $-3.40M | $-678.00K | $560.00K | $376.00K |
| Net Change in Cash | $1.23B | $172.40M | $35.11M | $21.06M | $-49.75M |
| Cash at End of Period | $1.67B | $440.96M | $268.56M | $233.45M | $212.39M |
| Cash at Beginning of Period | $440.96M | $268.56M | $233.45M | $212.39M | $262.14M |
| Operating Cash Flow | $-2.49B | $663.58M | $-440.80M | $122.95M | $-30.33M |
| Capital Expenditure | $-124.28M | $-36.79M | $-45.18M | $-58.02M | $-44.34M |
| Free Cash Flow | $-2.61B | $626.79M | $-485.98M | $64.94M | $-74.67M |
Cash Flow Charts
| Breakdown | December 31, 2024 | September 30, 2024 | June 30, 2024 | March 31, 2024 | December 31, 2023 | September 30, 2023 | June 30, 2023 | March 31, 2023 | December 31, 2022 | September 30, 2022 | June 30, 2022 | March 31, 2022 | December 31, 2021 | September 30, 2021 | June 30, 2021 | March 31, 2021 | December 31, 2020 | September 30, 2020 | June 30, 2020 | March 31, 2020 |
|---|---|---|---|---|---|---|---|---|---|---|---|---|---|---|---|---|---|---|---|---|
| Net Income | $320.60M | $424.33M | $297.24M | $402.46M | $295.97M | $157.00M | $145.80M | $85.85M | $176.17M | $184.42M | $140.82M | $76.97M | $41.93M | $25.44M | $39.16M | $18.43M | $27.67M | $26.60M | $18.45M | $15.81M |
| Depreciation and Amortization | $14.88M | $14.08M | $11.81M | $10.40M | $9.62M | $9.15M | $8.97M | $8.74M | $8.65M | $8.55M | $8.42M | $8.37M | $8.13M | $7.55M | $6.88M | $6.88M | $6.91M | $7.52M | $7.50M | $7.08M |
| Deferred Income Tax | $-29.53M | $-46.55M | $-24.01M | $-88.86M | $-32.60M | $-23.02M | $-14.34M | $-52.82M | $-6.59M | $-19.23M | $-3.59M | $-4.68M | $1.43M | $19.00K | $-5.66M | $-1.84M | $-659.00K | $-224.00K | $-9.34M | $-3.55M |
| Stock Based Compensation | $82.12M | $64.01M | $74.96M | $56.11M | $43.06M | $57.38M | $12.79M | $13.65M | $16.98M | $11.01M | $8.88M | $7.74M | $9.18M | $7.01M | $7.43M | $7.49M | $6.45M | $7.17M | $5.37M | $4.80M |
| Change in Working Capital | $-623.31M | $-44.56M | $-1.01B | $-1.89B | $-921.03M | $73.44M | $-179.13M | $133.91M | $-55.51M | $127.60M | $-174.32M | $-320.63M | $-111.54M | $-177.61M | $13.43M | $-156.68M | $16.77M | $81.98M | $-111.17M | $-52.42M |
| Accounts Receivables | $-334.66M | $15.29M | $-1.08B | $-153.19M | $-657.19M | $302.50M | $-477.79M | $97.86M | $-26.82M | $94.86M | $-155.13M | $-182.97M | $-39.35M | $5.86M | $-56.29M | $-84.19M | $121.00K | $81.03M | $-65.96M | $25.49M |
| Inventory | $1.33B | $-597.72M | $-220.97M | $-1.66B | $-414.19M | $-607.24M | $126.30M | $-124.62M | $298.44M | $-200.07M | $41.72M | $-205.05M | $-209.31M | $-147.09M | $-139.02M | $-99.58M | $-36.22M | $78.54M | $14.45M | $-165.67M |
| Accounts Payables | $-1.13B | $220.35M | $369.58M | $-170.00M | $176.64M | $302.97M | $136.25M | $81.79M | $-223.21M | $132.30M | $-122.89M | $89.84M | $137.53M | $-54.34M | $144.01M | $70.60M | $60.41M | $-85.70M | $-43.99M | $71.47M |
| Other Working Capital | $-492.74M | $317.51M | $-78.54M | $86.99M | $-26.29M | $75.21M | $36.10M | $78.88M | $-103.92M | $100.52M | $4.11M | $-22.45M | $-412.00K | $17.96M | $64.73M | $-43.51M | $-7.54M | $8.10M | $-15.67M | $16.29M |
| Other Non Cash Items | $-4.52M | $-2.40M | $9.43M | $-5.85M | $9.89M | $-3.48M | $16.57M | $8.92M | $21.38M | $1.24M | $-639.00K | $4.29M | $-2.28M | $3.02M | $2.32M | $1.31M | $6.10M | $-2.49M | $-6.86M | $6.84M |
| Net Cash Provided by Operating Activities | $-239.76M | $408.90M | $-641.81M | $-1.52B | $-595.09M | $270.46M | $-9.34M | $198.25M | $161.09M | $313.59M | $-25.14M | $-227.94M | $-53.15M | $-134.57M | $63.56M | $-124.41M | $63.25M | $120.56M | $-96.05M | $-21.44M |
| Investments in Property Plant and Equipment | $-27.54M | $-44.30M | $-13.98M | $-92.94M | $-14.72M | $-2.63M | $-8.18M | $-7.99M | $-9.88M | $-10.75M | $-11.03M | $-10.95M | $-12.40M | $-10.80M | $-13.39M | $-19.08M | $-13.70M | $-11.85M | $-9.45M | $-10.80M |
| Acquisitions Net | $- | $- | $- | $- | $- | $- | $-2.19M | $- | $- | $- | $- | $- | $- | $- | $- | $- | $- | $- | $- | $- |
| Purchases of Investments | $- | $- | $-48.00M | $-16.49M | $-184.00K | $-5.00M | $-500.00K | $- | $- | $- | $1.10M | $- | $- | $-1.10M | $- | $- | $- | $- | $- | $- |
| Sales Maturities of Investments | $- | $- | $- | $- | $- | $- | $2.19M | $- | $- | $- | $- | $- | $- | $- | $- | $- | $- | $- | $750.00K | $- |
| Other Investing Activities | $- | $- | $-296.00K | $- | $- | $- | $-2.19M | $- | $- | $- | $-1.10M | $- | $- | $-1.10M | $- | $- | $- | $- | $-750.00K | $- |
| Net Cash Used for Investing Activities | $-27.54M | $-44.30M | $-62.28M | $-109.43M | $-14.90M | $-7.63M | $-10.87M | $-7.99M | $-9.88M | $-10.75M | $-11.03M | $-10.95M | $-12.40M | $-11.90M | $-13.39M | $-19.08M | $-13.70M | $-11.85M | $-9.45M | $-10.80M |
| Debt Repayment | $-346.14M | $78.86M | $309.72M | $1.49B | $219.63M | $-138.94M | $105.56M | $14.51M | $-85.03M | $-335.60M | $55.33M | $236.86M | $40.09M | $180.33M | $11.50M | $40.88M | $7.97M | $6.11M | $-4.42M | $9.97M |
| Common Stock Issued | $- | $- | $-7.00K | $1.73B | $- | $- | $- | $- | $7.18M | $8.14M | $- | $4.36M | $5.57M | $6.02M | $- | $- | $- | $- | $- | $- |
| Common Stock Repurchased | $- | $- | $- | $- | $- | $- | $-3.47M | $-146.53M | $-6.79M | $-3.72M | $-3.27M | $-2.01M | $-2.73M | $-2.07M | $-12.03M | $-43.14M | $-46.37M | $-28.45M | $-1.81M | $-2.86M |
| Dividends Paid | $- | $- | $- | $- | $- | $- | $- | $- | $- | $- | $- | $- | $- | $- | $- | $- | $- | $- | $- | $- |
| Other Financing Activities | $-41.15M | $-29.00M | $-50.78M | $-204.93M | $572.50M | $-21.00M | $-3.09M | $551.00K | $391.00K | $4.41M | $1.18M | $2.34M | $2.82M | $3.93M | $4.54M | $7.51M | $4.03M | $3.02M | $2.83M | $17.49M |
| Net Cash Used Provided by Financing Activities | $-387.29M | $49.85M | $258.94M | $3.02B | $792.13M | $-159.94M | $99.00M | $-131.47M | $-84.64M | $-331.18M | $56.51M | $239.19M | $42.91M | $184.26M | $4.00M | $5.25M | $-34.37M | $-19.33M | $-1.58M | $27.46M |
| Effect of Forex Changes on Cash | $-3.66M | $4.50M | $-557.00K | $-1.80M | $373.00K | $-203.00K | $-1.13M | $-576.00K | $-221.00K | $-1.47M | $-374.00K | $-295.00K | $2.00K | $-11.00K | $198.00K | $-178.00K | $355.00K | $185.00K | $213.00K | $-12.00K |
| Net Change in Cash | $-658.24M | $418.96M | $-445.71M | $1.39B | $182.52M | $102.69M | $77.66M | $58.21M | $66.34M | $-29.81M | $19.96M | $10.00K | $-22.64M | $37.78M | $54.38M | $-138.41M | $15.53M | $89.56M | $-106.87M | $-4.79M |
| Cash at End of Period | $1.43B | $2.09B | $1.67B | $2.12B | $726.17M | $543.65M | $440.96M | $363.30M | $305.09M | $238.75M | $268.56M | $248.59M | $248.59M | $271.23M | $233.45M | $179.07M | $317.48M | $301.95M | $212.39M | $319.26M |
| Cash at Beginning of Period | $2.09B | $1.67B | $2.12B | $726.17M | $543.65M | $440.96M | $363.30M | $305.09M | $238.75M | $268.56M | $248.59M | $248.59M | $271.23M | $233.45M | $179.07M | $317.48M | $301.95M | $212.39M | $319.26M | $324.05M |
| Operating Cash Flow | $-239.76M | $408.90M | $-641.81M | $-1.52B | $-595.09M | $270.46M | $-9.34M | $198.25M | $161.09M | $313.59M | $-25.14M | $-227.94M | $-53.15M | $-134.57M | $63.56M | $-124.41M | $63.25M | $120.56M | $-96.05M | $-21.44M |
| Capital Expenditure | $-27.54M | $-44.30M | $-13.98M | $-92.94M | $-14.72M | $-2.63M | $-8.18M | $-7.99M | $-9.88M | $-10.75M | $-11.03M | $-10.95M | $-12.40M | $-10.80M | $-13.39M | $-19.08M | $-13.70M | $-11.85M | $-9.45M | $-10.80M |
| Free Cash Flow | $-267.29M | $364.60M | $-655.80M | $-1.61B | $-609.80M | $267.83M | $-17.51M | $190.26M | $151.20M | $302.84M | $-36.17M | $-238.89M | $-65.56M | $-145.37M | $50.17M | $-143.49M | $49.55M | $108.70M | $-105.50M | $-32.23M |
Super Micro Computer Dividends
Explore Super Micro Computer's dividend history, including dividend yield, payout ratio, and historical payments.
Super Micro Computer News
Read the latest news about Super Micro Computer, including recent articles, headlines, and updates.
Supermicro Ships Over 20 New Systems that Redefine Single-Socket Performance and Deliver Data Center Power, Space, and Cost Savings
New system architectures support Intel ® Xeon® 6 with P-Cores, providing up to 136 PCIe 5.0 lanes and expanding possibilities for high-speed networking, GPUs, and storage devices SAN JOSE, Calif. , March 27, 2025 /PRNewswire/ -- Super Micro Computer, Inc. (SMCI), a Total IT Solution Provider for AI/ML, HPC, Cloud, Storage, and 5G/Edge, is announcing the availability of new single-socket servers capable of supporting applications that required dual-socket servers for a range of data center workloads.


Tesla, GM, Ford, Super Micro, Nvidia, GameStop, Jefferies, and More Market Movers
Stock futures were mostly higher Thursday even as President Donald Trump slapped 25% tariffs on all cars made outside of the United States, leading to worries over what the trade war will mean to the U.S. and global economies.

Billionaire Philippe Laffont Dumped His Stake in a Consumer Favorite That's Risen 5,500% Since Its IPO in Favor of an Artificial Intelligence (AI) Stock-Split Stock
Wall Street is a data-dominated landscape, and it can be easy for investors to allow this overabundance of data to cause them to miss something important.


Super Micro Computer: Bears Need To Check Out Its Inventory (Rating Upgrade)
Since my latest Super Micro Computer analysis, new catalysts have further skewed its reward/risk curve and made it more attractive. First, SMCI has regained NASDAQ compliance, removing a key concern on my mind. In addition, its latest report shows a sharp decline in its inventory level.


Super Micro Stock: $7.2M Call Options Signal Big Upside Potential
There are typically two ways that investors can express their views on a stock, which is by buying it and making a profit if prices go up (the classic buy-low-sell-high method) or through a more complex process of shorting a stock so that a profit is made if the underlying prices lower from the entry point of the investor. However, when conviction is higher than usual, there is another method that traders tend to implement in order to get the best bang for their buck.

Super Micro Computer Feels The Heat From Competitors, Customers, Supplies - This Analyst Turns Bearish
While Super Micro Computer Inc's SMCI stock has gained 38% year-to-date, "making it the best performing stock in our Hardware coverage," there are downside risks on valuation, competition and gross margins, according to Goldman Sachs.


SMCI Downgrade, S&P 500 Reshuffle to Begin Week
Ahead of Monday's open, equities are higher and building on their first winning week in the last 5. Kevin Green discusses key levels to watch this week, Goldman Sachs downgrade of Supermicro (SMCI), and the addition of DoorDash (DASH), TKO Group (TKO), Williams-Sonoma (WSM) to the S&P 500.


When It Comes To Investing, Nobody's Perfect, But Two Out Of Three Ain't Bad
Predicting market outcomes is challenging; my recommendations are based on historical data and probabilities rather than certainties. I reviewed my 2025 picks: 67% of Buy ratings and 78% of Hold ratings delivered positive alpha, outperforming many experts. Midstream energy and covered call income funds have shown strong performance, while recent market corrections impacted some picks.

Looking for a Dirt Cheap AI Stock With Massive Upside? 1 Analyst Firm Thinks Super Micro Computer Can Soar 66%.
Super Micro Computer (SMCI 7.67%) is one of the more controversial stocks on Wall Street. After allegations of accounting missteps last year, an external committee found no wrongdoing, and the company hired a new accounting firm, which has released all the necessary financial statements to comply with Nasdaq stock exchange and Securities and Exchange Commission guidelines.

Housing data recap, Super Micro Computer upgraded by JPMorgan, Lennar issues weak Q2 outlook
Market Domination hosts Josh Lipton and Julie Hyman go over key insights from the trading day on March 21, 2025. First, they discuss Heathrow Airport's reopening after a nearby fire caused a power outage that disrupted travel earlier in the day.


Market Pullback After a Historic Rally: What Investors Should Do Now
Instead of blindly buying during a selloff, Jeremy Mullin offers a four-step plan for 2025 to help investors pinpoint stocks and industries that will lead the next leg higher. Learn how to develop a disciplined strategy to capitalize on the market's abundant opportunities.

SMCI Gathering Analyst Optimism as A.I. Skepticism Builds
Supermicro (SMCI) got an upgrade from JPMorgan Chase to neutral from underperform, giving the stock a bump higher this morning. Jeff Pierce notes the rally comes amid skepticism across the tech sector, as Supermicro itself recovers from its major sell-off following accounting uncertainties.

SMCI stock soars on Nvidia Blackwell boost
In the first quarter (Q1) of 2024, Super Micro Computer (NASDAQ: SMCI) proved a major challenger to Nvidia (NASDAQ: NVDA) as the year's stock market superstar. Specifically, Supermicro equity soared 300% in Q1, while NVDA shares were up about 70% in the same time frame.


Supermicro Introduces a New Petascale All-Flash Storage Server Using NVIDIA Grace CPU Superchip for High Performance Software-Defined AI Storage Workloads
New System Combines NVIDIA Power Efficient CPU with Supermicro's Petascale Architecture SAN JOSE, Calif. , March 19, 2025 /PRNewswire/ -- GTC 2025 Conference -- Supermicro, Inc. (NASDAQ: SMCI), a Total IT Solution Provider for AI, Cloud, Storage, and 5G/Edge, announced a new optimized storage server for high-performance software-defined storage workloads.

Similar Companies
Related Metrics
Explore detailed financial metrics and analysis for SMCI.