Emerson Radio Corp. (MSN)
Key Statistics
| Latest Price | $0.55 |
|---|---|
| Market Cap | $11.55M |
| Price Change ($) | $0.04 |
| Price Change (%) | 7.84% |
| Volume | 3.58K |
| Shares Outstanding | 21.04M |
| P/E Ratio | 13.72 |
| EPS | $0.04 |
MSN Chart
Description
Emerson Radio Corp., together with its subsidiaries, designs, sources, imports, markets, and sells various houseware and consumer electronic products under the Emerson brand in the United States and internationally. It offers houseware products, such as microwave ovens, compact refrigerators, wine products, and toaster ovens; audio products, including clock radios, Bluetooth speakers, and wireless charging products; and other products comprising massagers, toothbrushes, and security products. The company also licenses its trademarks to others on a worldwide basis for various products. Emerson Radio Corp. markets its products primarily through mass merchandisers and online marketplaces. The company was founded in 1912 and is headquartered in Parsippany, New Jersey.
About
CEO: Mr. Wing-On Ho
Exchange: AMEX
Sector: Technology
Industry: Consumer Electronics
Employees: -0.00B
Address: 35 Waterview Boulevard, Parsippany, NJ, US
Website: Emerson Radio Corp.
MSN News
FOX News Digital Leads News Brands With Multiplatform Minutes for 38th Consecutive Month
NEW YORK--(BUSINESS WIRE)--FOX News Digital finished April as the top news brand with multiplatform minutes for the 38th consecutive month, according to Comscore. FOX News Digital closed out the month reaching 3 billion total multiplatform minutes, 1.5 billion total multiplatform views, and 105 million total digital multiplatform unique visitors.* Additionally, FOX News Mobile App reached 5.6 million unique visitors in April.** FOX News Digital also led news brands with 2.6 average views per visit, seeing 3% growth year-over-year. FOX News was once again the most engaged brand on social media in the competitive set in April, with 24.8 million total social interactions, marking the 116th consecutive month FOX News has placed on top, according to Emplifi. FOX News drove 8.5 million interactions on Facebook (up 37% month-over-month), 14.5 million Instagram interactions and 1.8 million X interactions. On YouTube, FOX News secured 161.6 million video views, according to Shareablee.**** FOXBusiness.com drove 162 million multiplatform views in April, surpassing CNN Business for the 25th straight month and Bloomberg.com for the 36th consecutive month, while seeing 11% year-over-year growth. Additionally, the business site delivered 227 million multiplatform minutes and 25.8 million multiplatform unique visitors.*** FOX Business’ videos on YouTube remained the most viewed among the business news competitive set for the 29th straight month, achieving 52.5 million views in April.***** APRIL 2024 FOX NEWS DIGITAL VS. CNN.COM AND NYTIMES.COM Multi-Platform Total Views FOX News Digital – 1,532,000,000 (down 1% vs. April 2023) CNN.com – 1,222,000,000 (up 9% vs. April 2023) NYTimes.com – 1,553,000,000 (up 28% vs. April 2023) Multi-Platform Total Minutes FOX News Digital – 2,976,000,000 (down 8% vs. April 2023) CNN.com – 1,780,000,000 (down 2% vs. April 2023) NYTimes.com – 1,585,000,000 (up 30% vs. April 2023) Total Digital Multi-Platform Unique Visitors FOX News Digital – 104,813,000 (up 2% vs. April 2023) CNN.com – 106,205,000 (down 8% vs. April 2023) NYTimes.com – 73,422,000 (down 6% vs. April 2023) *Source: Comscore Media Metrix® Multi-Platform, Total Digital Population including Social Incremental data for reportable entities. Fox News Digital, CBSNews.com, NBCNews.com, WashingtonPost.com, and ABCNews.com have opted in to account for Social Incremental in Total Digital Multiplatform Unique Visitors, while brands like CNN.com and NYTimes.com have not opted in. Custom-Defined List including CNN.com, NBCNews.com, ABCNews.com, CBSNews.com, Fox News Digital, WashingtonPost.com, NYTimes.com, NYPost Network, Wall Street Journal Online, Insider Inc., and USAToday.com, April 2024, U.S. **Source: Comscore Media Metrix® Multi-Platform, Total Digital Population including Social Incremental data for reportable entities. Fox News Digital, CBSNews.com, NBCNews.com, WashingtonPost.com, and ABCNews.com have opted in to account for Social Incremental in Total Digital Multiplatform Unique Visitors, while brands like CNN.com and NYTimes.com have not opted in. Custom-Defined List including CNN.com, NBCNews.com, ABCNews.com, CBSNews.com, Fox News Digital, WashingtonPost.com, NYTimes.com, NYPost Network, Wall Street Journal Online, Insider Inc., and USAToday.com, April 2024, U.S. & Comscore Mobile Metrix®, Mobile App Only, [FOX News Mobile App and CNN Mobile App], April 2024, U.S. ***Source: Comscore Media Metrix® Multi-Platform, Total Digital Population including Social Incremental data for reportable entities. FoxBusiness.com, Yahoo! Finance, CNBC.com, TheStreet.com, Entrepreneur.com have opted in to account for Social Incremental in Total Digital Multiplatform Unique Visitors. Custom-Defined List including FoxBusiness.com, Bloomberg.com, CNBC.com, CNN Business, Entrepreneur.com, Forbes.com, HuffPost Business, MarketWatch, Motley Fool, MSN Money, TheStreet.com, USA TODAY Money, WSJ Online, Yahoo! Finance, April 2024, U.S. ****Source: Comscore Social, PowerRankings, YouTube, April 2024, Report Date: 5/20/2024. Custom-Defined List including CNN.com, NBCNews.com, ABCNews.com, CBSNews.com, Fox News Digital, WashingtonPost.com, NYTimes.com, NYPost Network, Wall Street Journal Online, Insider Inc., and USAToday.com. *****Source: Comscore Social, PowerRankings, YouTube, April 2024, Report Date: 5/20/2024. Custom-Defined List including FoxBusiness.com, Bloomberg.com, CNBC.com, CNN Business, Entrepreneur.com, Forbes.com, HuffPost Business, MarketWatch, Motley Fool, MSN Money, TheStreet.com, USA TODAY Money, WSJ Online, Yahoo! Finance. FOX News Media operates the FOX News Channel (FNC), FOX Business Network (FBN), FOX News Digital, FOX News Audio, FOX News Books, the direct-to-consumer streaming services FOX Nation and FOX News International and the free ad-supported television service FOX Weather. Currently the number one network in all of cable, FNC has also been the most watched television news channel for 22 consecutive years, while FBN is the top business channel on cable. Owned by Fox Corporation, FOX News Media reaches nearly 200 million people each month.
https://www.businesswire.com
Read More
Industrial Automation And Instrumentation Market In India Will Register an Incremental Growth of $2.58 Billion during 2020-2024 | Technavio
The Industrial Automation and Instrumentation Market in India will grow by USD 2.58 bn during 2020-2024
businesswire.com
Read More
Peloton Stock Has Soared. One Bullish Analyst Issues a Downgrade.
Peloton stock’s outperformance has already essentially reached the price target of a Goldman Sachs analyst.
marketwatch.com
Read More
Goldman’s Stock Rises on $2.9 Billion Settlement of 1MDB Scandal. Investors Hope a Dark Cloud Has Been Lifted.
The firm will also claw back and cut $174 million in compensation for current and former executives.
marketwatch.com
Read More
Gap shares up 11% on plans to close stores, focus on e-commerce and off-mall retail
Gap Inc. shares are up more than 11% after the retailer revealed plans Thursday to shrink its store footprint by about 350 stores and switch to a business model that's driven by e-commerce and off-mall locations.
cnbc.com
Read MoreEmerson Electric Co. (NYSE:EMR) Shares Sold by Pacer Advisors Inc.
Pacer Advisors Inc. cut its holdings in Emerson Electric Co. (NYSE:EMR) by 17.9% during the third quarter, according to the company in its most recent Form 13F filing with the SEC. The firm owned 42,084 shares of the industrial products company’s stock after selling 9,152 shares during the quarter. Pacer Advisors Inc.’s holdings in Emerson […]
thelincolnianonline.com
Read More
Financial Comparison: LRAD (NASDAQ:LRAD) and Emerson Radio (NASDAQ:MSN)
LRAD (NASDAQ:LRAD) and Emerson Radio (NYSE:MSN) are both small-cap consumer discretionary companies, but which is the superior investment? We will compare the two businesses based on the strength of their valuation, risk, analyst recommendations, dividends, earnings, profitability and institutional ownership. Valuation and Earnings This table compares LRAD and Emerson Radio’s top-line revenue, earnings per share […]
thelincolnianonline.com
Read More
Global Vinyl Ester Resin Suppliers Leadership & Benchmark Report 2020: Polynt, Ashland, Aliancys, AOC, Swancor, Showa Denko K.K., Sino Polymer, and Scott Bader - ResearchAndMarkets.com
The
businesswire.com
Read More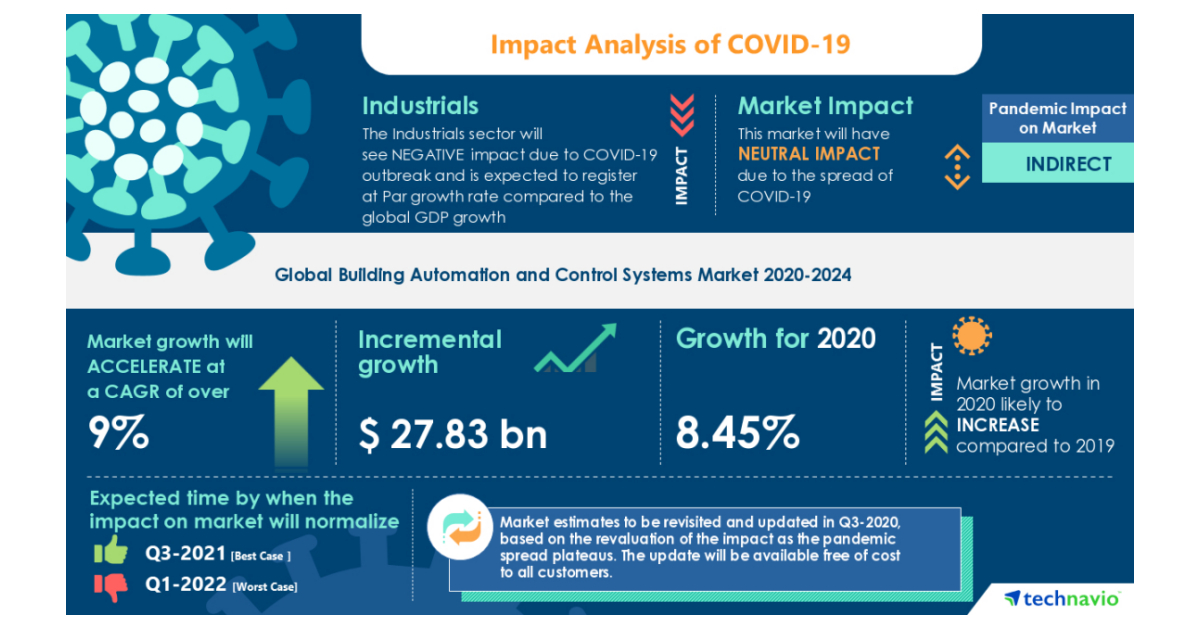
Global Building Automation and Control Systems Market Will Exhibit Neutral Impact During 2020-2024 | Growing Demand for Energy Efficiency to Improve the Market Growth | Technavio
The Global Building Automation and Control Systems Market will grow by $ 27.83 bn during 2020-2024
businesswire.com
Read More
Emerson Electric Gets Contract to Support Operations on Caspian Sea Platform | MarketScreener
marketscreener.com
Read More
Global $1.79 Billion Industrial I/O Modules (PLC & DCS) Markets, 2020-2024 - ResearchAndMarkets.com
The
businesswire.com
Read More
Goldman Is Crushing It. Its Stock Remains a Bargain.
The firm trades below book value even as it generated a 17.5% return on equity in the third quarter.
marketwatch.com
Read MoreFirst Citizens Bank & Trust Co. Has $611,000 Holdings in Emerson Electric Co. (NYSE:EMR)
First Citizens Bank & Trust Co. lessened its stake in Emerson Electric Co. (NYSE:EMR) by 8.8% in the 3rd quarter, according to its most recent disclosure with the Securities & Exchange Commission. The firm owned 9,315 shares of the industrial products company’s stock after selling 902 shares during the quarter. First Citizens Bank & Trust […]
thelincolnianonline.com
Read More
Emerson Electric: The Power To Generate Earnings (NYSE:EMR)
Emerson Electric has maintained its stability and consistency with its strong operations for the last 10 years.
seekingalpha.com
Read More
Global Computer On Module Market | Rising Need for Faster Product Development to Boost Market Growth | Technavio
The Global Computer on Module Market will grow by $ 360.19 mn during 2020-2024
businesswire.com
Read More
‘Cary Grant: A Brilliant Disguise’ Review: The Enigma of Charisma
The most serenely charming of Hollywood stars worked carefully to appear careless.
wsj.com
Read More
Global Industrial Motors Markets, 2020-2025: Very Low Voltage, Low Voltage, Medium Voltage, High Voltage - ResearchAndMarkets.com
The
businesswire.com
Read More
Pacific Coast Oil Trust Announces There Will Be No October Cash Distribution
PACIFIC COAST OIL TRUST (OTC Pink: ROYTL) (the “Trust”), a royalty trust formed by Pacific Coast Energy Company LP (“PCEC”), announced today that ther
businesswire.com
Read More
Credit Suisse Hires Veteran Meissner to Lead New Unit Serving Wealthy Clients
Christian Meissner will be co-head of international wealth-management investment banking advisory and vice chairman of investment banking.
wsj.com
Read More
Dividend Kings Analysis: 3M Is The Most Undervalued
A dividend growth analysis of the 30 Dividend Kings is presented. Commerce Bancshares, Target, Stepan Company, Hormel, and Cincinnati Financial are the Top 5 Dividend Kings in the ranking model.
seekingalpha.com
Read More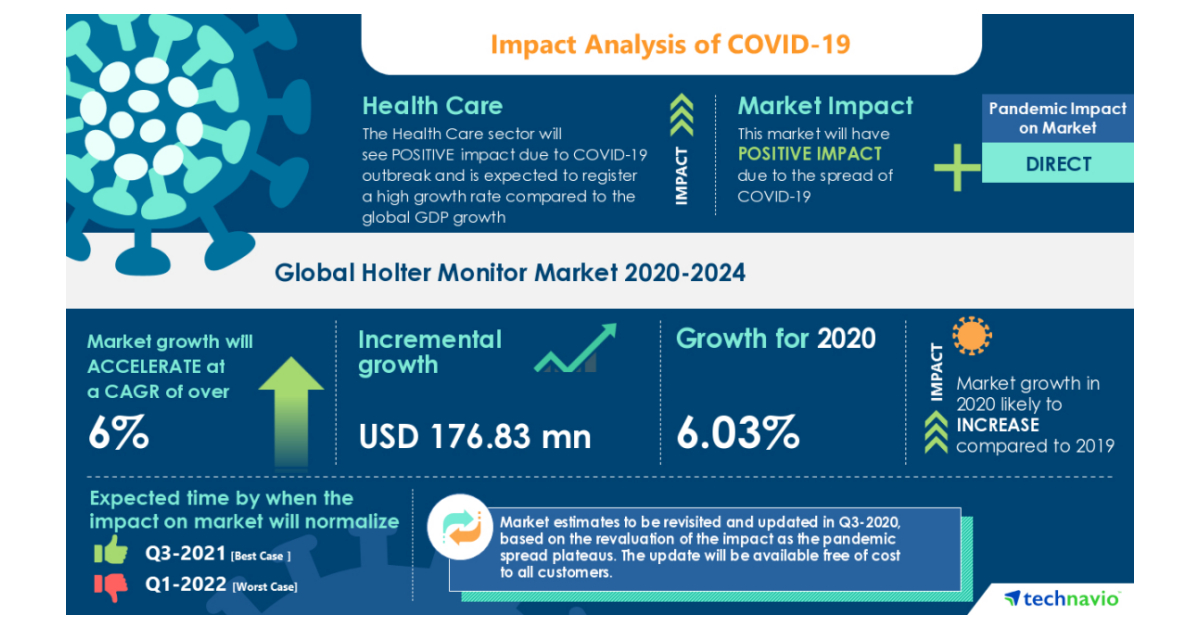
Global Holter Monitor Market will Showcase Positive Impact During 2020-2024 | Increasing Prevalence of Cardiac Disorders to Boost Market Growth | Technavio
The Global Holter Monitor Market will grow by USD 176.83 mn during 2020-2024
businesswire.com
Read MoreCooper Financial Group Buys New Position in Emerson Electric Co. (NYSE:EMR)
Cooper Financial Group bought a new stake in shares of Emerson Electric Co. (NYSE:EMR) in the 3rd quarter, according to the company in its most recent disclosure with the Securities & Exchange Commission. The firm bought 3,500 shares of the industrial products company’s stock, valued at approximately $229,000. A number of other hedge funds have […]
thelincolnianonline.com
Read MoreStitch Fix Inc (NASDAQ:SFIX) Insider Sells $54,760.00 in Stock
Stitch Fix Inc (NASDAQ:SFIX) insider Scott Darling sold 2,000 shares of the stock in a transaction that occurred on Friday, October 2nd. The stock was sold at an average price of $27.38, for a total value of $54,760.00. Following the transaction, the insider now directly owns 68,036 shares in the company, valued at approximately $1,862,825.68. […]
thelincolnianonline.com
Read More
Global Embedded Software Market (2020 to 2024) - Featuring Advantech, Emerson Electric & Enea Among Others - ResearchAndMarkets.com
The
businesswire.com
Read MoreAnnual Income Statement
| Breakdown | 2024-03-31 | 2023-03-31 | 2022-03-31 | 2021-03-31 | 2020-03-31 | 2019-03-31 | 2018-03-31 | 2017-03-31 | 2016-03-31 | 2015-03-31 |
|---|---|---|---|---|---|---|---|---|---|---|
| Revenue | $9.07M | $7.18M | $8.21M | $7.45M | $6.29M | $8.98M | $15.02M | $21.25M | $45.75M | $76.32M |
| Cost of Revenue | $7.51M | $5.08M | $6.24M | $5.75M | $6.75M | $8.76M | $13.92M | $16.28M | $38.82M | $62.09M |
| Gross Profit | $1.56M | $2.10M | $1.97M | $1.70M | $-462.00K | $222.00K | $1.10M | $4.97M | $6.93M | $14.23M |
| Gross Profit Ratio | 17.24% | 29.27% | 23.99% | 22.78% | -7.34% | 2.47% | 7.33% | 23.41% | 15.15% | 18.65% |
| Research and Development Expenses | $- | $- | $- | $- | $- | $- | $- | $- | $- | $- |
| General and Administrative Expenses | $- | $4.16M | $5.37M | $5.87M | $4.00M | $3.72M | $4.91M | $- | $7.95M | $- |
| Selling and Marketing Expenses | $- | $39.00K | $42.00K | $23.00K | $165.00K | $121.00K | $17.00K | $- | $19.00K | $- |
| Selling General and Administrative Expenses | $4.96M | $4.20M | $5.41M | $5.89M | $4.16M | $3.84M | $4.92M | $5.10M | $7.97M | $8.83M |
| Other Expenses | $- | $-34.00K | $-207.00K | $-83.00K | $- | $27.00K | $60.00K | $199.00K | $367.00K | $661.00K |
| Operating Expenses | $4.96M | $4.16M | $5.20M | $5.81M | $4.16M | $3.87M | $4.98M | $5.30M | $8.34M | $9.49M |
| Cost and Expenses | $12.47M | $9.24M | $11.44M | $11.56M | $10.92M | $12.63M | $18.90M | $21.58M | $47.16M | $71.58M |
| Interest Income | $1.16M | $712.00K | $68.00K | $158.00K | $776.00K | $859.00K | $496.00K | $261.00K | $178.00K | $215.00K |
| Interest Expense | $5.00K | $10.00K | $11.00K | $7.00K | $- | $859.00K | $4.00K | $261.00K | $178.00K | $215.00K |
| Depreciation and Amortization | $26.00K | $917.00K | $282.00K | $391.00K | $811.00K | $5.00K | $8.00K | $16.00K | $48.00K | $75.00K |
| EBITDA | $-3.37M | $-1.15M | $-2.95M | $-3.72M | $-3.81M | $-2.78M | $-3.38M | $-49.00K | $-1.18M | $4.75M |
| EBITDA Ratio | -37.19% | -15.95% | -35.96% | -49.98% | -60.62% | -31.00% | -22.49% | -0.23% | -2.58% | 6.22% |
| Operating Income | $-3.40M | $-2.06M | $-3.23M | $-4.11M | $-4.63M | $-3.65M | $-3.88M | $-326.00K | $-1.41M | $4.75M |
| Operating Income Ratio | -37.48% | -28.73% | -39.40% | -55.23% | -73.51% | -40.61% | -25.84% | -1.53% | -3.07% | 6.22% |
| Total Other Income Expenses Net | $4.25M | $702.00K | $-393.00K | $151.00K | $776.00K | $859.00K | $492.00K | $261.00K | $178.00K | $215.00K |
| Income Before Tax | $856.00K | $-1.36M | $-3.63M | $-3.96M | $-3.85M | $-2.79M | $-3.39M | $-65.00K | $-1.23M | $4.96M |
| Income Before Tax Ratio | 9.44% | -18.95% | -44.19% | -53.20% | -61.18% | -31.05% | -22.57% | -0.31% | -2.68% | 6.50% |
| Income Tax Expense | $90.00K | $-702.00K | $11.00K | $15.00K | $457.00K | $-352.00K | $3.46M | $172.00K | $-259.00K | $3.07M |
| Net Income | $766.00K | $-658.00K | $-3.64M | $-3.98M | $-4.31M | $-2.44M | $-6.85M | $-237.00K | $-968.00K | $1.89M |
| Net Income Ratio | 8.45% | -9.17% | -44.32% | -53.40% | -68.44% | -27.13% | -45.61% | -1.12% | -2.12% | 2.48% |
| EPS | $0.04 | $-0.03 | $-0.17 | $-0.19 | $-0.20 | $-0.11 | $-0.27 | $-0.01 | $-0.04 | $0.07 |
| EPS Diluted | $0.04 | $-0.03 | $-0.17 | $-0.19 | $-0.20 | $-0.11 | $-0.27 | $-0.01 | $-0.04 | $0.07 |
| Weighted Average Shares Outstanding | 21.04M | 21.04M | 21.04M | 21.04M | 21.04M | 21.93M | 25.28M | 27.11M | 27.13M | 27.13M |
| Weighted Average Shares Outstanding Diluted | 21.04M | 21.04M | 21.04M | 21.04M | 21.04M | 21.93M | 25.28M | 27.11M | 27.13M | 27.13M |
| SEC Filing | Source | Source | Source | Source | Source | Source | Source | Source | Source | Source |
Quarterly Income Statement
| Breakdown | 2024-03-31 | 2023-12-31 | 2023-09-30 | 2023-06-30 | 2023-03-31 | 2022-12-31 | 2022-09-30 | 2022-06-30 | 2022-03-31 | 2021-12-31 | 2021-09-30 | 2021-06-30 | 2021-03-31 | 2020-12-31 | 2020-09-30 | 2020-06-30 | 2020-03-31 | 2019-12-31 | 2019-09-30 | 2019-06-30 | 2019-03-31 | 2018-12-31 | 2018-09-30 | 2018-06-30 | 2018-03-31 | 2017-12-31 | 2017-09-30 | 2017-06-30 | 2017-03-31 | 2016-12-31 | 2016-09-30 | 2016-06-30 | 2016-03-31 | 2015-12-31 | 2015-09-30 | 2015-06-30 | 2015-03-31 | 2014-12-31 | 2014-09-30 |
|---|---|---|---|---|---|---|---|---|---|---|---|---|---|---|---|---|---|---|---|---|---|---|---|---|---|---|---|---|---|---|---|---|---|---|---|---|---|---|---|
| Revenue | $2.20M | $2.62M | $2.44M | $1.81M | $1.87M | $1.93M | $2.30M | $1.07M | $1.72M | $2.57M | $1.86M | $2.05M | $1.55M | $2.33M | $2.27M | $1.29M | $1.15M | $2.09M | $1.44M | $1.61M | $1.59M | $2.54M | $2.59M | $2.26M | $4.06M | $4.24M | $3.72M | $3.00M | $3.65M | $4.93M | $6.03M | $6.63M | $8.14M | $9.15M | $8.94M | $19.51M | $13.23M | $22.90M | $14.25M |
| Cost of Revenue | $1.85M | $2.14M | $2.04M | $1.47M | $1.53M | $1.36M | $1.31M | $879.00K | $1.45M | $1.83M | $1.35M | $1.61M | $1.23M | $1.75M | $1.75M | $1.02M | $1.35M | $2.10M | $1.55M | $1.75M | $1.76M | $2.36M | $2.43M | $2.21M | $3.63M | $4.05M | $3.48M | $2.77M | $3.36M | $3.36M | $4.46M | $5.10M | $6.78M | $7.49M | $7.55M | $17.00M | $10.65M | $17.25M | $11.79M |
| Gross Profit | $349.00K | $478.00K | $398.00K | $339.00K | $344.00K | $571.00K | $991.00K | $195.00K | $270.00K | $748.00K | $508.00K | $443.00K | $317.00K | $579.00K | $524.00K | $276.00K | $-200.00K | $-11.00K | $-115.00K | $-135.00K | $-165.00K | $183.00K | $152.00K | $52.00K | $434.00K | $190.00K | $247.00K | $230.00K | $298.00K | $1.57M | $1.57M | $1.54M | $1.36M | $1.66M | $1.40M | $2.51M | $2.59M | $5.65M | $2.46M |
| Gross Profit Ratio | 15.86% | 18.23% | 16.32% | 18.74% | 18.39% | 29.55% | 43.09% | 18.16% | 15.69% | 29.06% | 27.33% | 21.59% | 20.49% | 24.82% | 23.07% | 21.33% | -17.38% | -0.53% | -8.01% | -8.37% | -10.36% | 7.20% | 5.88% | 2.30% | 10.68% | 4.49% | 6.64% | 7.66% | 8.16% | 31.88% | 25.99% | 23.15% | 16.75% | 18.18% | 15.62% | 12.85% | 19.55% | 24.68% | 17.28% |
| Research and Development Expenses | $- | $- | $- | $- | $- | $- | $- | $- | $- | $- | $- | $- | $- | $- | $- | $- | $- | $- | $- | $- | $- | $- | $- | $- | $- | $- | $- | $- | $- | $- | $- | $- | $- | $- | $- | $- | $- | $- | $- |
| General and Administrative Expenses | $- | $- | $- | $- | $472.00K | $- | $- | $- | $1.17M | $- | $- | $- | $1.27M | $- | $- | $- | $791.00K | $- | $- | $- | $839.00K | $- | $- | $- | $1.12M | $- | $- | $- | $- | $- | $- | $- | $1.90M | $- | $- | $- | $- | $- | $- |
| Selling and Marketing Expenses | $- | $- | $- | $- | $39.00K | $- | $- | $- | $42.00K | $- | $- | $- | $23.00K | $- | $- | $- | $165.00K | $- | $- | $- | $121.00K | $- | $- | $- | $17.00K | $- | $- | $- | $- | $- | $- | $- | $19.00K | $- | $- | $- | $- | $- | $- |
| Selling General and Administrative Expenses | $1.50M | $1.20M | $1.06M | $1.20M | $511.00K | $1.05M | $1.29M | $1.34M | $1.21M | $1.47M | $1.36M | $1.36M | $1.29M | $1.56M | $1.56M | $1.48M | $956.00K | $1.15M | $973.00K | $1.08M | $960.00K | $948.00K | $918.00K | $1.02M | $1.14M | $1.10M | $1.40M | $1.28M | $1.22M | $1.20M | $1.20M | $1.49M | $1.92M | $1.65M | $2.08M | $2.32M | $2.26M | $1.84M | $2.31M |
| Other Expenses | $- | $- | $- | $- | $34.00K | $-4.00K | $-8.00K | $- | $207.00K | $- | $-207.00K | $- | $83.00K | $-28.00K | $-55.00K | $- | $-1.00K | $- | $- | $1.00K | $5.00K | $2.00K | $8.00K | $12.00K | $22.00K | $14.00K | $17.00K | $7.00K | $-1.00K | $23.00K | $44.00K | $133.00K | $66.00K | $60.00K | $167.00K | $74.00K | $101.00K | $116.00K | $127.00K |
| Operating Expenses | $1.50M | $1.20M | $1.06M | $1.20M | $511.00K | $1.05M | $1.28M | $1.32M | $1.21M | $1.47M | $1.16M | $1.36M | $1.29M | $1.53M | $1.51M | $1.48M | $956.00K | $1.15M | $973.00K | $1.08M | $965.00K | $950.00K | $926.00K | $1.03M | $1.16M | $1.11M | $1.42M | $1.29M | $1.22M | $1.22M | $1.24M | $1.62M | $1.98M | $1.71M | $2.25M | $2.39M | $2.36M | $1.96M | $2.43M |
| Cost and Expenses | $3.35M | $3.35M | $3.10M | $2.67M | $2.04M | $2.41M | $2.59M | $2.20M | $2.66M | $3.29M | $2.51M | $2.97M | $2.52M | $3.29M | $3.26M | $2.50M | $2.31M | $3.26M | $2.52M | $2.83M | $2.72M | $3.31M | $3.36M | $3.24M | $4.79M | $5.16M | $4.89M | $4.06M | $4.58M | $4.58M | $5.70M | $6.72M | $8.76M | $9.20M | $9.79M | $19.40M | $13.01M | $19.20M | $14.22M |
| Interest Income | $288.00K | $289.00K | $289.00K | $294.00K | $288.00K | $235.00K | $139.00K | $50.00K | $28.00K | $7.00K | $16.00K | $17.00K | $30.00K | $18.00K | $28.00K | $82.00K | $138.00K | $179.00K | $222.00K | $237.00K | $242.00K | $240.00K | $202.00K | $175.00K | $131.00K | $131.00K | $130.00K | $104.00K | $99.00K | $54.00K | $57.00K | $51.00K | $57.00K | $43.00K | $39.00K | $39.00K | $64.00K | $42.00K | $44.00K |
| Interest Expense | $- | $- | $- | $- | $434.00K | $-235.00K | $139.00K | $- | $17.00K | $7.00K | $16.00K | $17.00K | $23.00K | $18.00K | $28.00K | $82.00K | $138.00K | $179.00K | $222.00K | $237.00K | $242.00K | $240.00K | $202.00K | $175.00K | $127.00K | $131.00K | $130.00K | $104.00K | $99.00K | $54.00K | $57.00K | $51.00K | $57.00K | $43.00K | $39.00K | $39.00K | $64.00K | $42.00K | $44.00K |
| Depreciation and Amortization | $8.00K | $51.00K | $49.00K | $38.00K | $46.00K | $53.00K | $53.00K | $53.00K | $-332.00K | $51.00K | $53.00K | $60.00K | $60.00K | $59.00K | $57.00K | $57.00K | $-2.00K | $-4.00K | $-10.00K | $51.00K | $859.00K | $1.00K | $2.00K | $2.00K | $2.00K | $2.00K | $2.00K | $2.00K | $3.00K | $6.00K | $2.00K | $5.00K | $7.00K | $8.00K | $16.00K | $17.00K | $18.00K | $27.00K | $22.00K |
| EBITDA | $-1.14M | $-673.00K | $-3.72M | $-821.00K | $591.00K | $-423.00K | $-239.00K | $-1.07M | $-1.27M | $-220.00K | $-595.00K | $-861.00K | $-755.00K | $-894.00K | $-928.00K | $-1.14M | $-380.00K | $-1.16M | $-1.09M | $-1.17M | $-271.00K | $-766.00K | $-772.00K | $-975.00K | $-229.00K | $-922.00K | $-1.17M | $-1.06M | $-657.00K | $358.00K | $329.00K | $-79.00K | $-432.00K | $-42.00K | $-835.00K | $130.00K | $230.00K | $3.72M | $52.00K |
| EBITDA Ratio | -51.89% | -25.67% | -152.46% | -45.38% | 31.59% | -21.89% | -10.39% | -100.00% | -74.08% | -8.55% | -32.01% | -41.96% | -48.80% | -38.32% | -40.86% | -88.41% | -33.01% | -55.54% | -75.82% | -72.41% | -17.02% | -30.15% | -29.85% | -43.08% | -5.64% | -21.77% | -31.43% | -35.22% | -17.98% | 7.26% | 5.46% | -1.19% | -5.31% | -0.46% | -9.34% | 0.67% | 1.74% | 16.25% | 0.36% |
| Operating Income | $-1.15M | $-724.00K | $-666.00K | $-859.00K | $545.00K | $-476.00K | $-292.00K | $-1.15M | $-943.00K | $-721.00K | $-855.00K | $-921.00K | $-973.00K | $-981.00K | $-1.04M | $-1.20M | $-1.16M | $-1.16M | $-1.09M | $-1.22M | $-1.13M | $-767.00K | $-774.00K | $-977.00K | $-727.00K | $-924.00K | $-1.17M | $-1.06M | $-921.00K | $352.00K | $327.00K | $-84.00K | $-617.00K | $-50.00K | $-851.00K | $113.00K | $230.00K | $3.69M | $30.00K |
| Operating Income Ratio | -52.25% | -27.61% | -27.32% | -47.48% | 29.13% | -24.64% | -12.70% | -106.98% | -54.79% | -28.01% | -45.99% | -44.88% | -62.90% | -42.05% | -45.79% | -92.81% | -100.43% | -55.54% | -75.82% | -75.57% | -70.98% | -30.18% | -29.93% | -43.17% | -17.89% | -21.81% | -31.49% | -35.29% | -25.21% | 7.13% | 5.42% | -1.27% | -7.58% | -0.55% | -9.52% | 0.58% | 1.74% | 16.13% | 0.21% |
| Total Other Income Expenses Net | $283.00K | $289.00K | $3.10M | $294.00K | $-434.00K | $235.00K | $139.00K | $72.00K | $17.00K | $-450.00K | $223.00K | $17.00K | $23.00K | $46.00K | $83.00K | $82.00K | $138.00K | $179.00K | $222.00K | $237.00K | $242.00K | $240.00K | $202.00K | $175.00K | $127.00K | $131.00K | $130.00K | $104.00K | $99.00K | $54.00K | $57.00K | $51.00K | $57.00K | $43.00K | $39.00K | $39.00K | $64.00K | $42.00K | $44.00K |
| Income Before Tax | $-867.00K | $-435.00K | $2.72M | $-565.00K | $111.00K | $-241.00K | $-153.00K | $-1.08M | $-926.00K | $-1.16M | $-632.00K | $-904.00K | $-950.00K | $-935.00K | $-957.00K | $-1.12M | $-1.02M | $-984.00K | $-866.00K | $-982.00K | $-888.00K | $-527.00K | $-572.00K | $-802.00K | $-600.00K | $-793.00K | $-1.04M | $-955.00K | $-822.00K | $406.00K | $384.00K | $-33.00K | $-560.00K | $-7.00K | $-812.00K | $152.00K | $294.00K | $3.74M | $74.00K |
| Income Before Tax Ratio | -39.39% | -16.59% | 111.69% | -31.23% | 5.93% | -12.47% | -6.65% | -100.28% | -53.81% | -45.22% | -34.00% | -44.05% | -61.41% | -40.08% | -42.14% | -86.48% | -88.44% | -46.99% | -60.35% | -60.88% | -55.78% | -20.74% | -22.12% | -35.44% | -14.77% | -18.72% | -28.00% | -31.82% | -22.50% | 8.23% | 6.37% | -0.50% | -6.88% | -0.08% | -9.08% | 0.78% | 2.22% | 16.32% | 0.52% |
| Income Tax Expense | $16.00K | $-14.00K | $88.00K | $- | $434.00K | $-235.00K | $139.00K | $22.00K | $-11.00K | $7.00K | $207.00K | $11.00K | $158.00K | $10.00K | $-1.00K | $6.00K | $438.00K | $4.00K | $10.00K | $5.00K | $-425.00K | $2.00K | $23.00K | $48.00K | $3.15M | $378.00K | $- | $-65.00K | $-26.00K | $-42.00K | $219.00K | $21.00K | $-247.00K | $59.00K | $-102.00K | $31.00K | $1.95M | $882.00K | $27.00K |
| Net Income | $-883.00K | $-421.00K | $2.63M | $-565.00K | $-323.00K | $-6.00K | $-292.00K | $-1.08M | $-915.00K | $-1.16M | $-632.00K | $-915.00K | $-950.00K | $-945.00K | $-956.00K | $-1.12M | $-1.46M | $-988.00K | $-876.00K | $-987.00K | $-463.00K | $-529.00K | $-595.00K | $-850.00K | $-3.75M | $-1.17M | $-1.04M | $-890.00K | $-796.00K | $448.00K | $165.00K | $-54.00K | $-313.00K | $-66.00K | $-710.00K | $121.00K | $-1.66M | $2.85M | $47.00K |
| Net Income Ratio | -40.12% | -16.06% | 108.08% | -31.23% | -17.26% | -0.31% | -12.70% | -100.28% | -53.17% | -45.22% | -34.00% | -44.59% | -61.41% | -40.51% | -42.10% | -86.94% | -126.50% | -47.18% | -61.05% | -61.19% | -29.08% | -20.82% | -23.01% | -37.56% | -92.25% | -27.64% | -28.00% | -29.66% | -21.78% | 9.08% | 2.74% | -0.81% | -3.84% | -0.72% | -7.94% | 0.62% | -12.53% | 12.46% | 0.33% |
| EPS | $-0.04 | $-0.02 | $0.13 | $-0.03 | $-0.02 | $0.00 | $-0.01 | $-0.05 | $-0.04 | $-0.06 | $-0.03 | $-0.04 | $-0.05 | $-0.04 | $-0.05 | $-0.05 | $-0.07 | $-0.05 | $-0.04 | $-0.05 | $-0.02 | $-0.02 | $-0.03 | $-0.04 | $-0.17 | $-0.05 | $-0.04 | $-0.03 | $-0.03 | $0.02 | $0.01 | $0.00 | $-0.01 | $0.00 | $-0.03 | $0.00 | $-0.06 | $0.11 | $0.00 |
| EPS Diluted | $-0.04 | $-0.02 | $0.13 | $-0.03 | $-0.02 | $0.00 | $-0.01 | $-0.05 | $-0.04 | $-0.06 | $-0.03 | $-0.04 | $-0.05 | $-0.04 | $-0.05 | $-0.05 | $-0.07 | $-0.05 | $-0.04 | $-0.05 | $-0.02 | $-0.02 | $-0.03 | $-0.04 | $-0.17 | $-0.05 | $-0.04 | $-0.03 | $-0.03 | $0.02 | $0.01 | $0.00 | $-0.01 | $0.00 | $-0.03 | $0.00 | $-0.06 | $0.11 | $0.00 |
| Weighted Average Shares Outstanding | 21.04M | 21.04M | 21.04M | 21.04M | 21.04M | 21.04M | 21.04M | 21.04M | 21.04M | 21.04M | 21.04M | 21.04M | 21.04M | 21.04M | 21.04M | 21.04M | 21.04M | 21.04M | 21.04M | 21.04M | 21.04M | 21.64M | 22.41M | 22.62M | 22.62M | 23.42M | 26.05M | 27.06M | 26.48M | 27.13M | 27.13M | 27.13M | 27.13M | 27.13M | 27.13M | 27.13M | 27.13M | 27.13M | 27.13M |
| Weighted Average Shares Outstanding Diluted | 21.04M | 21.04M | 21.04M | 21.04M | 21.04M | 21.04M | 21.04M | 21.04M | 21.04M | 21.04M | 21.04M | 21.04M | 21.04M | 21.04M | 21.04M | 21.04M | 21.04M | 21.04M | 21.04M | 21.04M | 21.04M | 21.64M | 22.41M | 22.62M | 22.62M | 24.30M | 26.22M | 27.06M | 27.06M | 27.13M | 27.13M | 27.13M | 27.13M | 27.13M | 27.13M | 27.13M | 27.13M | 27.13M | 27.13M |
| SEC Filing | Source | Source | Source | Source | Source | Source | Source | Source | Source | Source | Source | Source | Source | Source | Source | Source | Source | Source | Source | Source | Source | Source | Source | Source | Source | Source | Source | Source | Source | Source | Source | Source | Source | Source | Source | Source | Source | Source | Source |
Annual Balance Sheet
| Breakdown | 2024-03-31 | 2023-03-31 | 2022-03-31 | 2021-03-31 | 2020-03-31 | 2019-03-31 | 2018-03-31 | 2017-03-31 | 2016-03-31 | 2015-03-31 |
|---|---|---|---|---|---|---|---|---|---|---|
| Cash and Cash Equivalents | $19.89M | $25.27M | $25.58M | $5.25M | $6.28M | $7.92M | $25.10M | $27.47M | $30.10M | $43.48M |
| Short Term Investments | $- | $- | $- | $25.05M | $28.10M | $28.37M | $16.00M | $25.08M | $20.16M | $- |
| Cash and Short Term Investments | $19.89M | $25.27M | $25.58M | $30.29M | $34.38M | $36.29M | $41.10M | $52.55M | $50.25M | $43.48M |
| Net Receivables | $1.38M | $1.41M | $1.29M | $691.00K | $484.00K | $607.00K | $1.95M | $1.31M | $4.09M | $7.80M |
| Inventory | $6.95M | $3.81M | $2.11M | $1.96M | $1.92M | $3.52M | $3.16M | $838.00K | $2.06M | $4.52M |
| Other Current Assets | $381.00K | $357.00K | $531.00K | $650.00K | $577.00K | $421.00K | $497.00K | $1.49M | $556.00K | $702.00K |
| Total Current Assets | $28.60M | $31.09M | $29.51M | $33.59M | $37.36M | $41.25M | $47.06M | $56.94M | $58.33M | $60.93M |
| Property Plant Equipment Net | $377.00K | $202.00K | $407.00K | $216.00K | $451.00K | $6.00K | $14.00K | $18.00K | $29.00K | $77.00K |
| Goodwill | $- | $- | $- | $- | $- | $- | $- | $- | $- | $- |
| Intangible Assets | $- | $- | $- | $- | $- | $- | $- | $- | $- | $- |
| Goodwill and Intangible Assets | $- | $- | $- | $- | $- | $- | $- | $- | $- | $- |
| Long Term Investments | $- | $- | $- | $- | $- | $- | $- | $- | $- | $- |
| Tax Assets | $- | $- | $- | $- | $- | $448.00K | $528.00K | $791.00K | $1.40M | $1.06M |
| Other Non-Current Assets | $84.00K | $74.00K | $90.00K | $94.00K | $94.00K | $154.00K | $151.00K | $101.00K | $132.00K | $102.00K |
| Total Non-Current Assets | $461.00K | $276.00K | $497.00K | $310.00K | $545.00K | $608.00K | $693.00K | $910.00K | $1.56M | $1.24M |
| Other Assets | $- | $- | $- | $- | $- | $- | $- | $- | $- | $- |
| Total Assets | $29.07M | $31.37M | $30.01M | $33.90M | $37.90M | $41.86M | $47.76M | $57.85M | $59.89M | $62.16M |
| Account Payables | $1.16M | $641.00K | $758.00K | $788.00K | $592.00K | $545.00K | $803.00K | $756.00K | $1.69M | $2.14M |
| Short Term Debt | $93.00K | $140.00K | $212.00K | $357.00K | $242.00K | $- | $- | $- | $- | $- |
| Tax Payables | $531.00K | $401.00K | $195.00K | $195.00K | $195.00K | $250.00K | $250.00K | $165.00K | $455.00K | $847.00K |
| Deferred Revenue | $191.00K | $3.46M | $210.00K | $195.00K | $180.00K | $165.00K | $50.00K | $- | $- | $- |
| Other Current Liabilities | $532.00K | $402.00K | $195.00K | $196.00K | $195.00K | $250.00K | $250.00K | $165.00K | $967.00K | $1.35M |
| Total Current Liabilities | $1.97M | $4.65M | $1.38M | $1.54M | $1.21M | $960.00K | $1.10M | $921.00K | $2.66M | $3.48M |
| Long Term Debt | $198.00K | $62.00K | $203.00K | $85.00K | $238.00K | $- | $- | $- | $- | $- |
| Deferred Revenue Non-Current | $- | $- | $- | $- | $- | $- | $- | $- | $- | $- |
| Deferred Tax Liabilities Non-Current | $- | $- | $- | $- | $- | $- | $- | $- | $- | $- |
| Other Non-Current Liabilities | $668.00K | $1.20M | $1.61M | $1.84M | $2.03M | $2.17M | $2.87M | $- | $- | $481.00K |
| Total Non-Current Liabilities | $866.00K | $1.26M | $1.82M | $1.92M | $2.27M | $2.17M | $2.87M | $- | $- | $481.00K |
| Other Liabilities | $-0.00B | $- | $- | $- | $- | $- | $- | $- | $- | $- |
| Total Liabilities | $2.84M | $5.91M | $3.19M | $3.46M | $3.48M | $3.13M | $3.97M | $921.00K | $2.66M | $3.96M |
| Preferred Stock | $3.31M | $3.31M | $3.31M | $3.31M | $3.31M | $3.31M | $3.31M | $3.31M | $3.31M | $3.31M |
| Common Stock | $529.00K | $529.00K | $529.00K | $529.00K | $529.00K | $529.00K | $529.00K | $529.00K | $529.00K | $529.00K |
| Retained Earnings | $-24.20M | $-24.97M | $-23.61M | $-19.98M | $-16.01M | $-11.70M | $-9.27M | $-2.41M | $-2.18M | $-1.21M |
| Accumulated Other Comprehensive Income Loss | $-529.00K | $-3.31M | $-0.00B | $- | $- | $-412.00K | $-507.00K | $-506.00K | $-511.00K | $-482.00K |
| Other Total Stockholders Equity | $47.12M | $49.90M | $46.59M | $46.59M | $46.59M | $47.00M | $49.72M | $56.01M | $56.08M | $56.05M |
| Total Stockholders Equity | $26.23M | $25.46M | $26.82M | $30.45M | $34.42M | $38.73M | $43.78M | $56.93M | $57.23M | $58.20M |
| Total Equity | $26.23M | $25.46M | $26.82M | $30.45M | $34.42M | $38.73M | $43.78M | $56.93M | $57.23M | $58.20M |
| Total Liabilities and Stockholders Equity | $29.07M | $31.37M | $30.01M | $33.90M | $37.90M | $41.86M | $47.76M | $57.85M | $59.89M | $62.16M |
| Minority Interest | $- | $- | $- | $- | $- | $- | $- | $- | $- | $- |
| Total Liabilities and Total Equity | $29.07M | $31.37M | $30.01M | $33.90M | $37.90M | $41.86M | $47.76M | $57.85M | $59.89M | $62.16M |
| Total Investments | $- | $- | $- | $25.05M | $28.10M | $28.37M | $16.00M | $25.08M | $20.16M | $- |
| Total Debt | $291.00K | $202.00K | $415.00K | $442.00K | $480.00K | $- | $- | $- | $- | $- |
| Net Debt | $-19.60M | $-25.07M | $-25.16M | $-4.80M | $-5.80M | $-7.92M | $-25.10M | $-27.47M | $-30.10M | $-43.48M |
Quarterly Balance Sheet
| Breakdown | 2024-03-31 | 2023-12-31 | 2023-09-30 | 2023-06-30 | 2023-03-31 | 2022-12-31 | 2022-09-30 | 2022-06-30 | 2022-03-31 | 2021-12-31 | 2021-09-30 | 2021-06-30 | 2021-03-31 | 2020-12-31 | 2020-09-30 | 2020-06-30 | 2020-03-31 | 2019-12-31 | 2019-09-30 | 2019-06-30 | 2019-03-31 | 2018-12-31 | 2018-09-30 | 2018-06-30 | 2018-03-31 | 2017-12-31 | 2017-09-30 | 2017-06-30 | 2017-03-31 | 2016-12-31 | 2016-09-30 | 2016-06-30 | 2016-03-31 | 2015-12-31 | 2015-09-30 | 2015-06-30 | 2015-03-31 | 2014-12-31 | 2014-09-30 |
|---|---|---|---|---|---|---|---|---|---|---|---|---|---|---|---|---|---|---|---|---|---|---|---|---|---|---|---|---|---|---|---|---|---|---|---|---|---|---|---|
| Cash and Cash Equivalents | $19.89M | $3.64M | $20.87M | $24.67M | $25.27M | $27.29M | $27.77M | $24.91M | $25.58M | $24.74M | $26.02M | $4.42M | $5.25M | $30.51M | $6.51M | $6.09M | $6.28M | $6.50M | $5.08M | $7.26M | $7.92M | $21.93M | $23.36M | $23.26M | $25.10M | $20.82M | $21.93M | $49.42M | $27.47M | $41.57M | $39.02M | $42.73M | $30.10M | $27.61M | $38.32M | $27.67M | $43.48M | $24.21M | $26.76M |
| Short Term Investments | $- | $18.50M | $- | $- | $- | $- | $- | $- | $- | $- | $- | $24.06M | $25.05M | $- | $25.00M | $27.20M | $28.10M | $27.96M | $29.81M | $28.58M | $28.37M | $14.03M | $15.01M | $17.09M | $16.00M | $22.23M | $23.18M | $80.00K | $25.08M | $10.27M | $13.06M | $10.15M | $20.16M | $20.11M | $10.09M | $15.10M | $- | $15.03M | $15.00M |
| Cash and Short Term Investments | $19.89M | $22.14M | $20.87M | $24.67M | $25.27M | $27.29M | $27.77M | $24.91M | $25.58M | $24.74M | $26.02M | $28.48M | $30.29M | $30.51M | $31.51M | $33.29M | $34.38M | $34.46M | $34.90M | $35.84M | $36.29M | $35.96M | $38.37M | $40.34M | $41.10M | $43.05M | $45.10M | $49.51M | $52.55M | $51.84M | $52.09M | $52.88M | $50.25M | $47.73M | $48.40M | $42.77M | $43.48M | $39.24M | $41.76M |
| Net Receivables | $1.38M | $1.31M | $1.84M | $1.20M | $1.41M | $1.12M | $1.12M | $561.00K | $1.29M | $2.62M | $1.49M | $1.09M | $691.00K | $1.47M | $859.00K | $508.00K | $484.00K | $862.00K | $673.00K | $863.00K | $607.00K | $912.00K | $1.21M | $1.02M | $1.95M | $1.66M | $1.84M | $1.66M | $1.31M | $925.00K | $1.12M | $1.68M | $4.09M | $4.33M | $4.51M | $10.77M | $7.80M | $12.77M | $7.08M |
| Inventory | $6.95M | $5.76M | $5.74M | $3.71M | $3.81M | $2.35M | $2.56M | $2.43M | $2.11M | $2.57M | $2.90M | $1.98M | $1.96M | $1.88M | $2.08M | $2.13M | $1.92M | $2.59M | $2.62M | $3.35M | $3.52M | $4.62M | $3.19M | $3.84M | $3.16M | $3.07M | $3.42M | $4.42M | $838.00K | $2.67M | $3.89M | $3.83M | $2.06M | $4.67M | $4.59M | $4.52M | $4.52M | $4.44M | $5.68M |
| Other Current Assets | $381.00K | $364.00K | $414.00K | $296.00K | $357.00K | $254.00K | $505.00K | $268.00K | $531.00K | $383.00K | $566.00K | $281.00K | $289.00K | $384.00K | $522.00K | $291.00K | $327.00K | $416.00K | $589.00K | $353.00K | $421.00K | $572.00K | $603.00K | $484.00K | $497.00K | $576.00K | $830.00K | $581.00K | $1.49M | $2.23M | $800.00K | $605.00K | $556.00K | $583.00K | $628.00K | $472.00K | $702.00K | $1.78M | $1.56M |
| Total Current Assets | $28.60M | $29.72M | $29.25M | $30.23M | $31.09M | $31.66M | $31.96M | $28.45M | $29.51M | $30.61M | $31.43M | $32.57M | $33.59M | $34.75M | $35.47M | $36.56M | $37.36M | $38.42M | $39.20M | $40.43M | $41.25M | $42.10M | $44.58M | $45.89M | $47.06M | $49.80M | $51.56M | $56.31M | $56.94M | $57.84M | $58.41M | $59.95M | $58.33M | $59.95M | $60.97M | $61.00M | $60.93M | $62.29M | $59.16M |
| Property Plant Equipment Net | $377.00K | $419.00K | $448.00K | $214.00K | $202.00K | $248.00K | $301.00K | $354.00K | $407.00K | $460.00K | $509.00K | $156.00K | $216.00K | $278.00K | $337.00K | $394.00K | $451.00K | $506.00K | $557.00K | $610.00K | $6.00K | $8.00K | $9.00K | $11.00K | $14.00K | $16.00K | $18.00K | $20.00K | $18.00K | $21.00K | $25.00K | $27.00K | $29.00K | $36.00K | $44.00K | $60.00K | $77.00K | $95.00K | $112.00K |
| Goodwill | $- | $- | $- | $- | $- | $- | $- | $- | $- | $- | $- | $- | $- | $- | $- | $- | $- | $- | $- | $- | $- | $- | $- | $- | $- | $- | $- | $- | $- | $- | $- | $- | $- | $- | $- | $- | $- | $- | $- |
| Intangible Assets | $- | $- | $- | $- | $- | $- | $- | $- | $- | $- | $- | $- | $- | $- | $- | $- | $- | $- | $- | $- | $- | $- | $- | $- | $- | $- | $- | $- | $- | $- | $- | $- | $- | $- | $- | $- | $- | $- | $- |
| Goodwill and Intangible Assets | $- | $- | $- | $- | $- | $- | $- | $- | $- | $- | $- | $- | $- | $- | $- | $- | $- | $- | $- | $- | $- | $- | $- | $- | $- | $- | $- | $- | $- | $- | $- | $- | $- | $- | $- | $- | $- | $- | $- |
| Long Term Investments | $- | $- | $- | $- | $- | $- | $- | $- | $- | $- | $- | $- | $- | $- | $- | $- | $- | $- | $- | $- | $- | $- | $- | $- | $- | $- | $- | $- | $- | $- | $- | $- | $- | $- | $- | $- | $- | $- | $- |
| Tax Assets | $- | $- | $- | $- | $- | $- | $- | $- | $- | $- | $- | $- | $- | $- | $- | $- | $- | $437.00K | $442.00K | $448.00K | $448.00K | $448.00K | $450.00K | $485.00K | $528.00K | $569.00K | $815.00K | $812.00K | $791.00K | $1.01M | $1.32M | $1.38M | $1.40M | $651.00K | $1.17M | $1.08M | $1.06M | $1.15M | $2.06M |
| Other Non-Current Assets | $84.00K | $84.00K | $84.00K | $84.00K | $74.00K | $90.00K | $90.00K | $90.00K | $90.00K | $90.00K | $94.00K | $94.00K | $94.00K | $94.00K | $94.00K | $94.00K | $94.00K | $94.00K | $135.00K | $154.00K | $154.00K | $157.00K | $158.00K | $158.00K | $151.00K | $172.00K | $101.00K | $101.00K | $101.00K | $131.00K | $132.00K | $131.00K | $132.00K | $127.00K | $127.00K | $126.00K | $102.00K | $86.00K | $87.00K |
| Total Non-Current Assets | $461.00K | $503.00K | $532.00K | $298.00K | $276.00K | $338.00K | $391.00K | $444.00K | $497.00K | $550.00K | $603.00K | $250.00K | $310.00K | $372.00K | $431.00K | $488.00K | $545.00K | $1.04M | $1.13M | $1.21M | $608.00K | $613.00K | $617.00K | $654.00K | $693.00K | $757.00K | $934.00K | $933.00K | $910.00K | $1.17M | $1.48M | $1.54M | $1.56M | $814.00K | $1.34M | $1.26M | $1.24M | $1.33M | $2.26M |
| Other Assets | $- | $- | $- | $- | $- | $- | $- | $- | $- | $- | $- | $- | $- | $- | $- | $- | $- | $- | $- | $- | $- | $- | $- | $- | $- | $- | $- | $- | $- | $- | $- | $- | $- | $- | $- | $- | $- | $- | $- |
| Total Assets | $29.07M | $30.22M | $29.78M | $30.53M | $31.37M | $31.99M | $32.35M | $28.89M | $30.01M | $31.16M | $32.03M | $32.82M | $33.90M | $35.12M | $35.90M | $37.05M | $37.90M | $39.45M | $40.33M | $41.64M | $41.86M | $42.71M | $45.20M | $46.55M | $47.76M | $50.56M | $52.49M | $57.24M | $57.85M | $59.01M | $59.89M | $61.49M | $59.89M | $60.76M | $62.31M | $62.26M | $62.16M | $63.62M | $61.42M |
| Account Payables | $1.16M | $1.29M | $580.00K | $705.00K | $641.00K | $514.00K | $642.00K | $847.00K | $758.00K | $1.14M | $734.00K | $747.00K | $788.00K | $928.00K | $905.00K | $776.00K | $592.00K | $811.00K | $591.00K | $720.00K | $545.00K | $636.00K | $717.00K | $873.00K | $803.00K | $1.09M | $981.00K | $1.07M | $756.00K | $1.07M | $1.12M | $1.98M | $1.69M | $1.65M | $2.63M | $2.00M | $2.14M | $2.85M | $3.92M |
| Short Term Debt | $93.00K | $129.00K | $163.00K | $143.00K | $140.00K | $146.00K | $168.00K | $190.00K | $212.00K | $226.00K | $221.00K | $318.00K | $357.00K | $396.00K | $433.00K | $451.00K | $242.00K | $237.00K | $232.00K | $228.00K | $- | $- | $- | $- | $- | $- | $- | $- | $- | $- | $-628.00K | $-1.52M | $- | $- | $- | $- | $- | $- | $- |
| Tax Payables | $531.00K | $609.00K | $622.00K | $401.00K | $401.00K | $401.00K | $401.00K | $205.00K | $195.00K | $195.00K | $195.00K | $195.00K | $195.00K | $195.00K | $195.00K | $195.00K | $195.00K | $195.00K | $195.00K | $195.00K | $250.00K | $250.00K | $250.00K | $250.00K | $250.00K | $295.00K | $166.00K | $166.00K | $165.00K | $165.00K | $490.00K | $456.00K | $455.00K | $574.00K | $1.01M | $918.00K | $847.00K | $- | $- |
| Deferred Revenue | $191.00K | $212.00K | $- | $3.16M | $3.46M | $4.28M | $4.21M | $140.00K | $210.00K | $- | $65.00K | $130.00K | $195.00K | $260.00K | $60.00K | $120.00K | $180.00K | $-616.00K | $55.00K | $110.00K | $165.00K | $- | $- | $- | $50.00K | $- | $- | $- | $- | $- | $938.00K | $1.88M | $- | $- | $- | $- | $- | $- | $- |
| Other Current Liabilities | $532.00K | $610.00K | $623.00K | $402.00K | $402.00K | $402.00K | $401.00K | $205.00K | $195.00K | $196.00K | $196.00K | $197.00K | $196.00K | $196.00K | $195.00K | $195.00K | $195.00K | $811.00K | $195.00K | $196.00K | $250.00K | $255.00K | $250.00K | $250.00K | $250.00K | $295.00K | $166.00K | $166.00K | $165.00K | $165.00K | $1.12M | $1.98M | $967.00K | $1.07M | $1.51M | $1.42M | $1.35M | $500.00K | $500.00K |
| Total Current Liabilities | $1.97M | $2.24M | $1.37M | $4.41M | $4.65M | $5.34M | $5.42M | $1.38M | $1.38M | $1.56M | $1.22M | $1.39M | $1.54M | $1.78M | $1.59M | $1.54M | $1.21M | $1.24M | $1.07M | $1.25M | $960.00K | $891.00K | $967.00K | $1.12M | $1.10M | $1.38M | $1.15M | $1.23M | $921.00K | $1.24M | $2.55M | $4.31M | $2.66M | $2.72M | $4.14M | $3.41M | $3.48M | $3.35M | $4.42M |
| Long Term Debt | $198.00K | $208.00K | $219.00K | $25.00K | $62.00K | $99.00K | $133.00K | $168.00K | $203.00K | $246.00K | $304.00K | $59.00K | $85.00K | $108.00K | $132.00K | $174.00K | $238.00K | $300.00K | $360.00K | $420.00K | $- | $- | $- | $- | $- | $- | $- | $- | $- | $- | $- | $- | $- | $- | $- | $- | $- | $- | $- |
| Deferred Revenue Non-Current | $- | $- | $- | $- | $- | $- | $- | $- | $- | $- | $- | $- | $- | $- | $- | $- | $- | $- | $- | $- | $- | $- | $- | $- | $- | $- | $- | $- | $- | $- | $- | $- | $- | $- | $- | $- | $- | $- | $- |
| Deferred Tax Liabilities Non-Current | $- | $- | $- | $- | $- | $- | $- | $- | $- | $- | $- | $- | $- | $- | $- | $- | $- | $- | $- | $- | $- | $- | $- | $- | $- | $- | $- | $- | $- | $- | $- | $- | $- | $- | $- | $- | $- | $416.00K | $- |
| Other Non-Current Liabilities | $668.00K | $668.00K | $668.00K | $1.20M | $1.20M | $1.20M | $1.20M | $1.60M | $1.61M | $1.61M | $1.61M | $1.84M | $1.84M | $1.84M | $1.84M | $2.03M | $2.03M | $2.03M | $2.03M | $2.23M | $2.17M | $2.62M | $2.62M | $2.87M | $2.87M | $- | $- | $- | $- | $- | $- | $- | $- | $493.00K | $565.00K | $525.00K | $481.00K | $- | $- |
| Total Non-Current Liabilities | $866.00K | $876.00K | $887.00K | $1.23M | $1.26M | $1.30M | $1.33M | $1.77M | $1.82M | $1.86M | $1.92M | $1.90M | $1.92M | $1.94M | $1.97M | $2.21M | $2.27M | $2.33M | $2.39M | $2.65M | $2.17M | $2.62M | $2.62M | $2.87M | $2.87M | $- | $- | $- | $- | $- | $- | $- | $- | $493.00K | $565.00K | $525.00K | $481.00K | $416.00K | $- |
| Other Liabilities | $-0.00B | $- | $- | $- | $- | $- | $- | $- | $- | $- | $- | $- | $- | $- | $- | $- | $- | $- | $- | $- | $- | $- | $- | $- | $- | $- | $- | $- | $- | $- | $- | $- | $- | $- | $- | $- | $- | $- | $- |
| Total Liabilities | $2.84M | $3.11M | $2.25M | $5.64M | $5.91M | $6.64M | $6.76M | $3.15M | $3.19M | $3.42M | $3.13M | $3.29M | $3.46M | $3.72M | $3.56M | $3.75M | $3.48M | $3.58M | $3.46M | $3.90M | $3.13M | $3.51M | $3.59M | $3.99M | $3.97M | $1.38M | $1.15M | $1.23M | $921.00K | $1.24M | $2.55M | $4.31M | $2.66M | $3.22M | $4.70M | $3.94M | $3.96M | $3.77M | $4.42M |
| Preferred Stock | $3.31M | $3.31M | $3.31M | $3.31M | $3.31M | $3.31M | $3.31M | $3.31M | $3.31M | $3.31M | $3.31M | $3.31M | $3.31M | $3.31M | $3.31M | $3.31M | $3.31M | $3.31M | $3.31M | $3.31M | $3.31M | $3.31M | $3.31M | $3.31M | $3.31M | $3.31M | $3.31M | $3.31M | $3.31M | $3.31M | $3.31M | $3.31M | $3.31M | $3.31M | $3.31M | $3.31M | $3.31M | $3.31M | $3.31M |
| Common Stock | $529.00K | $529.00K | $529.00K | $529.00K | $529.00K | $529.00K | $529.00K | $529.00K | $529.00K | $529.00K | $529.00K | $529.00K | $529.00K | $529.00K | $529.00K | $529.00K | $529.00K | $529.00K | $529.00K | $529.00K | $529.00K | $529.00K | $529.00K | $529.00K | $529.00K | $529.00K | $529.00K | $529.00K | $529.00K | $529.00K | $529.00K | $529.00K | $529.00K | $529.00K | $529.00K | $529.00K | $529.00K | $529.00K | $529.00K |
| Retained Earnings | $-24.20M | $-23.32M | $-22.90M | $-25.54M | $-24.97M | $-25.08M | $-24.84M | $-24.69M | $-23.61M | $-22.70M | $-21.53M | $-20.90M | $-19.98M | $-19.04M | $-18.09M | $-17.13M | $-16.01M | $-14.55M | $-13.56M | $-12.69M | $-11.70M | $-11.24M | $-10.71M | $-10.12M | $-9.27M | $-5.52M | $-4.35M | $-3.30M | $-2.41M | $-1.62M | $-2.07M | $-2.23M | $-2.18M | $-1.86M | $-1.80M | $-1.09M | $-1.21M | $450.00K | $-2.40M |
| Accumulated Other Comprehensive Income Loss | $-529.00K | $-3.31M | $--0.00B | $-3.31M | $-0.00B | $- | $- | $--0.00B | $-0.00B | $--0.00B | $--0.00B | $- | $- | $--0.00B | $-0.00B | $- | $-388.00K | $--0.00B | $--0.00B | $--0.00B | $-412.00K | $- | $--0.00B | $- | $-507.00K | $--0.00B | $--0.00B | $--0.00B | $-506.00K | $--0.00B | $--0.00B | $--0.00B | $-511.00K | $--0.00B | $--0.00B | $--0.00B | $-482.00K | $- | $- |
| Other Total Stockholders Equity | $47.12M | $49.90M | $46.59M | $49.90M | $46.59M | $46.59M | $46.59M | $46.59M | $46.59M | $46.59M | $46.59M | $46.59M | $46.59M | $46.59M | $46.59M | $46.59M | $46.98M | $46.59M | $46.59M | $46.59M | $47.00M | $46.60M | $48.48M | $48.83M | $49.72M | $50.86M | $51.85M | $55.48M | $56.01M | $55.55M | $55.57M | $55.57M | $56.08M | $55.57M | $55.57M | $55.57M | $56.05M | $55.57M | $55.57M |
| Total Stockholders Equity | $26.23M | $27.11M | $27.53M | $24.89M | $25.46M | $25.35M | $25.59M | $25.74M | $26.82M | $27.73M | $28.90M | $29.53M | $30.45M | $31.39M | $32.34M | $33.30M | $34.42M | $35.88M | $36.87M | $37.74M | $38.73M | $39.20M | $41.61M | $42.55M | $43.78M | $49.18M | $51.34M | $56.01M | $56.93M | $57.77M | $57.34M | $57.18M | $57.23M | $57.54M | $57.61M | $58.32M | $58.20M | $59.86M | $57.01M |
| Total Equity | $26.23M | $27.11M | $27.53M | $24.89M | $25.46M | $25.35M | $25.59M | $25.74M | $26.82M | $27.73M | $28.90M | $29.53M | $30.45M | $31.39M | $32.34M | $33.30M | $34.42M | $35.88M | $36.87M | $37.74M | $38.73M | $39.20M | $41.61M | $42.55M | $43.78M | $49.18M | $51.34M | $56.01M | $56.93M | $57.77M | $57.34M | $57.18M | $57.23M | $57.54M | $57.61M | $58.32M | $58.20M | $59.86M | $57.01M |
| Total Liabilities and Stockholders Equity | $29.07M | $30.22M | $29.78M | $30.53M | $31.37M | $31.99M | $32.35M | $28.89M | $30.01M | $31.16M | $32.03M | $32.82M | $33.90M | $35.12M | $35.90M | $37.05M | $37.90M | $39.45M | $40.33M | $41.64M | $41.86M | $42.71M | $45.20M | $46.55M | $47.76M | $50.56M | $52.49M | $57.24M | $57.85M | $59.01M | $59.89M | $61.49M | $59.89M | $60.76M | $62.31M | $62.26M | $62.16M | $63.62M | $61.42M |
| Minority Interest | $- | $- | $- | $- | $- | $- | $- | $- | $- | $- | $- | $- | $- | $- | $- | $- | $- | $- | $- | $- | $- | $- | $- | $- | $- | $- | $- | $- | $- | $- | $- | $- | $- | $- | $- | $- | $- | $- | $- |
| Total Liabilities and Total Equity | $29.07M | $30.22M | $29.78M | $30.53M | $31.37M | $31.99M | $32.35M | $28.89M | $30.01M | $31.16M | $32.03M | $32.82M | $33.90M | $35.12M | $35.90M | $37.05M | $37.90M | $39.45M | $40.33M | $41.64M | $41.86M | $42.71M | $45.20M | $46.55M | $47.76M | $50.56M | $52.49M | $57.24M | $57.85M | $59.01M | $59.89M | $61.49M | $59.89M | $60.76M | $62.31M | $62.26M | $62.16M | $63.62M | $61.42M |
| Total Investments | $- | $18.50M | $- | $- | $- | $- | $- | $- | $- | $- | $- | $24.06M | $25.05M | $- | $25.00M | $27.20M | $28.10M | $27.96M | $29.81M | $28.58M | $28.37M | $14.03M | $15.01M | $17.09M | $16.00M | $22.23M | $23.18M | $80.00K | $25.08M | $10.27M | $13.06M | $10.15M | $20.16M | $20.11M | $10.09M | $15.10M | $- | $15.03M | $15.00M |
| Total Debt | $291.00K | $337.00K | $382.00K | $168.00K | $202.00K | $245.00K | $301.00K | $358.00K | $415.00K | $472.00K | $525.00K | $377.00K | $442.00K | $504.00K | $565.00K | $625.00K | $480.00K | $537.00K | $592.00K | $648.00K | $- | $- | $- | $- | $- | $- | $- | $- | $- | $- | $- | $- | $- | $- | $- | $- | $- | $- | $- |
| Net Debt | $-19.60M | $-3.30M | $-20.49M | $-24.50M | $-25.07M | $-27.05M | $-27.47M | $-24.55M | $-25.16M | $-24.27M | $-25.50M | $-4.04M | $-4.80M | $-30.01M | $-5.95M | $-5.47M | $-5.80M | $-5.96M | $-4.49M | $-6.61M | $-7.92M | $-21.93M | $-23.36M | $-23.26M | $-25.10M | $-20.82M | $-21.93M | $-49.42M | $-27.47M | $-41.57M | $-39.02M | $-42.73M | $-30.10M | $-27.61M | $-38.32M | $-27.67M | $-43.48M | $-24.21M | $-26.76M |
Annual Cash Flow Statement
| Breakdown | 2024-03-31 | 2023-03-31 | 2022-03-31 | 2021-03-31 | 2020-03-31 | 2019-03-31 | 2018-03-31 | 2017-03-31 | 2016-03-31 | 2015-03-31 |
|---|---|---|---|---|---|---|---|---|---|---|
| Net Income | $766.00K | $-1.36M | $-3.63M | $-3.98M | $-4.31M | $-2.44M | $-6.85M | $-237.00K | $-968.00K | $1.89M |
| Depreciation and Amortization | $26.00K | $205.00K | $214.00K | $233.00K | $35.00K | $5.00K | $8.00K | $16.00K | $48.00K | $75.00K |
| Deferred Income Tax | $- | $- | $- | $- | $448.00K | $80.00K | $263.00K | $610.00K | $619.00K | $1.13M |
| Stock Based Compensation | $- | $- | $- | $- | $- | $- | $- | $- | $- | $- |
| Change in Working Capital | $-6.22M | $811.00K | $-1.10M | $-528.00K | $1.91M | $355.00K | $1.59M | $1.48M | $7.07M | $1.37M |
| Accounts Receivables | $30.00K | $93.00K | $-609.00K | $-185.00K | $117.00K | $1.48M | $-510.00K | $2.15M | $2.23M | $-18.00K |
| Inventory | $-3.14M | $-1.70M | $-151.00K | $-43.00K | $1.60M | $-356.00K | $-2.33M | $1.22M | $2.46M | $919.00K |
| Accounts Payables | $517.00K | $-117.00K | $-30.00K | $196.00K | $47.00K | $-258.00K | $47.00K | $-935.00K | $-446.00K | $-1.81M |
| Other Working Capital | $-3.62M | $2.54M | $-312.00K | $-496.00K | $144.00K | $-507.00K | $4.38M | $-949.00K | $2.81M | $2.28M |
| Other Non Cash Items | $2.81M | $36.00K | $-198.00K | $-22.00K | $3.00K | $-193.00K | $-166.00K | $-4.14M | $-6.39M | $160.00K |
| Net Cash Provided by Operating Activities | $-5.26M | $-308.00K | $-4.71M | $-4.29M | $-1.91M | $-2.19M | $-5.16M | $1.87M | $6.77M | $4.47M |
| Investments in Property Plant and Equipment | $-119.00K | $- | $-2.00K | $-2.00K | $- | $- | $-4.00K | $-5.00K | $- | $-10.00K |
| Acquisitions Net | $- | $- | $- | $2.00K | $- | $- | $- | $- | $- | $-2.00K |
| Purchases of Investments | $-18.50M | $- | $- | $-25.05M | $-1.58M | $-56.48M | $-61.06M | $-4.92M | $-20.16M | $- |
| Sales Maturities of Investments | $18.50M | $- | $25.05M | $28.10M | $1.85M | $44.11M | $70.14M | $- | $- | $- |
| Other Investing Activities | $- | $- | $25.05M | $2.00K | $270.00K | $-12.37M | $9.08M | $500.00K | $-20.16M | $31.69M |
| Net Cash Used for Investing Activities | $-119.00K | $- | $25.04M | $3.06M | $270.00K | $-12.37M | $9.07M | $-4.43M | $-20.16M | $31.68M |
| Debt Repayment | $-1.00K | $-2.00K | $- | $-204.00K | $- | $- | $- | $- | $- | $- |
| Common Stock Issued | $- | $- | $- | $- | $- | $- | $- | $- | $- | $- |
| Common Stock Repurchased | $- | $- | $- | $- | $- | $-2.62M | $-6.29M | $-66.00K | $- | $- |
| Dividends Paid | $- | $- | $- | $- | $- | $- | $- | $- | $- | $-18.99M |
| Other Financing Activities | $- | $- | $- | $204.00K | $- | $- | $- | $- | $- | $- |
| Net Cash Used Provided by Financing Activities | $-1.00K | $-2.00K | $- | $204.00K | $- | $-2.62M | $-6.29M | $-66.00K | $- | $-18.99M |
| Effect of Forex Changes on Cash | $- | $- | $- | $- | $- | $- | $- | $- | $- | $- |
| Net Change in Cash | $-5.38M | $-308.00K | $20.33M | $-1.03M | $-1.64M | $-17.18M | $-2.38M | $-2.62M | $-13.39M | $17.16M |
| Cash at End of Period | $19.89M | $25.27M | $25.58M | $5.25M | $6.28M | $7.92M | $25.10M | $27.47M | $30.10M | $43.48M |
| Cash at Beginning of Period | $25.27M | $25.58M | $5.25M | $6.28M | $7.92M | $25.10M | $27.47M | $30.10M | $43.48M | $26.33M |
| Operating Cash Flow | $-5.26M | $-308.00K | $-4.71M | $-4.29M | $-1.91M | $-2.19M | $-5.16M | $1.87M | $6.77M | $4.47M |
| Capital Expenditure | $-119.00K | $- | $-2.00K | $-2.00K | $- | $- | $-4.00K | $-5.00K | $- | $-10.00K |
| Free Cash Flow | $-5.38M | $-308.00K | $-4.71M | $-4.29M | $-1.91M | $-2.19M | $-5.16M | $1.86M | $6.77M | $4.46M |
Quarterly Cash Flow Statement
| Breakdown | 2024-03-31 | 2023-12-31 | 2023-09-30 | 2023-06-30 | 2023-03-31 | 2022-12-31 | 2022-09-30 | 2022-06-30 | 2022-03-31 | 2021-12-31 | 2021-09-30 | 2021-06-30 | 2021-03-31 | 2020-12-31 | 2020-09-30 | 2020-06-30 | 2020-03-31 | 2019-12-31 | 2019-09-30 | 2019-06-30 | 2019-03-31 | 2018-12-31 | 2018-09-30 | 2018-06-30 | 2018-03-31 | 2017-12-31 | 2017-09-30 | 2017-06-30 | 2017-03-31 | 2016-12-31 | 2016-09-30 | 2016-06-30 | 2016-03-31 | 2015-12-31 | 2015-09-30 | 2015-06-30 | 2015-03-31 | 2014-12-31 | 2014-09-30 |
|---|---|---|---|---|---|---|---|---|---|---|---|---|---|---|---|---|---|---|---|---|---|---|---|---|---|---|---|---|---|---|---|---|---|---|---|---|---|---|---|
| Net Income | $-883.00K | $-421.00K | $2.63M | $-565.00K | $111.00K | $-241.00K | $-153.00K | $-1.08M | $-915.00K | $-1.16M | $-632.00K | $-915.00K | $-950.00K | $-945.00K | $-956.00K | $-1.12M | $-1.46M | $-988.00K | $-876.00K | $-987.00K | $-463.00K | $-529.00K | $-595.00K | $-850.00K | $-3.75M | $-1.17M | $-1.04M | $-890.00K | $-796.00K | $448.00K | $165.00K | $-54.00K | $-313.00K | $-66.00K | $-710.00K | $121.00K | $-1.66M | $2.85M | $47.00K |
| Depreciation and Amortization | $8.00K | $51.00K | $49.00K | $38.00K | $46.00K | $53.00K | $53.00K | $53.00K | $50.00K | $51.00K | $53.00K | $60.00K | $60.00K | $59.00K | $57.00K | $57.00K | $-2.00K | $-4.00K | $-10.00K | $51.00K | $-5.00K | $1.00K | $2.00K | $2.00K | $2.00K | $2.00K | $2.00K | $2.00K | $3.00K | $6.00K | $2.00K | $5.00K | $7.00K | $8.00K | $16.00K | $17.00K | $18.00K | $27.00K | $22.00K |
| Deferred Income Tax | $- | $- | $- | $- | $- | $- | $- | $- | $- | $- | $- | $- | $- | $- | $- | $- | $437.00K | $5.00K | $6.00K | $- | $-80.00K | $2.00K | $35.00K | $43.00K | $41.00K | $246.00K | $-3.00K | $-21.00K | $43.00K | $59.00K | $-102.00K | $18.00K | $-27.00K | $- | $27.00K | $- | $- | $- | $-60.00K |
| Stock Based Compensation | $- | $- | $- | $- | $- | $- | $- | $- | $- | $- | $- | $- | $- | $- | $- | $- | $- | $- | $- | $- | $- | $- | $- | $- | $- | $- | $- | $- | $- | $- | $- | $- | $- | $- | $- | $- | $- | $- | $- |
| Change in Working Capital | $-1.41M | $1.64M | $-6.47M | $-42.00K | $-2.18M | $-355.00K | $2.96M | $391.00K | $1.84M | $-244.00K | $-1.73M | $-968.00K | $700.00K | $-115.00K | $-914.00K | $-199.00K | $951.00K | $496.00K | $-80.00K | $543.00K | $816.00K | $-8.00K | $-1.03M | $579.00K | $3.58M | $-206.00K | $237.00K | $-2.02M | $937.00K | $-680.00K | $-960.00K | $2.18M | $2.21M | $-618.00K | $6.33M | $-856.00K | $4.76M | $-5.38M | $13.23M |
| Accounts Receivables | $-65.00K | $725.00K | $-665.00K | $-46.00K | $-235.00K | $80.00K | $-520.00K | $768.00K | $1.47M | $-1.21M | $-455.00K | $-410.00K | $809.00K | $-609.00K | $-384.00K | $-1.00K | $393.00K | $-244.00K | $180.00K | $-212.00K | $164.00K | $327.00K | $-92.00K | $1.08M | $-112.00K | $115.00K | $-305.00K | $-208.00K | $-52.00K | $178.00K | $632.00K | $1.39M | $259.00K | $661.00K | $6.37M | $-5.06M | $5.63M | $-3.44M | $10.65M |
| Inventory | $-1.19M | $-21.00K | $-2.03M | $106.00K | $-1.47M | $214.00K | $-126.00K | $-321.00K | $462.00K | $325.00K | $-922.00K | $-16.00K | $-85.00K | $201.00K | $50.00K | $-209.00K | $669.00K | $34.00K | $734.00K | $165.00K | $1.10M | $-1.43M | $653.00K | $-679.00K | $-93.00K | $346.00K | $999.00K | $-3.58M | $1.83M | $1.22M | $-55.00K | $-1.78M | $2.62M | $-88.00K | $-66.00K | $-1.00K | $-79.00K | $1.24M | $3.25M |
| Accounts Payables | $-129.00K | $707.00K | $-125.00K | $64.00K | $127.00K | $-128.00K | $-205.00K | $89.00K | $-384.00K | $408.00K | $-13.00K | $-41.00K | $-140.00K | $23.00K | $129.00K | $184.00K | $-219.00K | $220.00K | $-129.00K | $175.00K | $-91.00K | $-81.00K | $-156.00K | $70.00K | $-284.00K | $106.00K | $-85.00K | $310.00K | $-317.00K | $-45.00K | $-862.00K | $289.00K | $41.00K | $-982.00K | $636.00K | $-141.00K | $-713.00K | $-1.06M | $-787.00K |
| Other Working Capital | $-24.00K | $231.00K | $-3.65M | $-166.00K | $-604.00K | $-521.00K | $3.81M | $-70.00K | $291.00K | $235.00K | $-337.00K | $-501.00K | $116.00K | $270.00K | $-709.00K | $-173.00K | $108.00K | $486.00K | $-865.00K | $415.00K | $-355.00K | $1.17M | $-1.44M | $111.00K | $4.07M | $-773.00K | $-372.00K | $1.46M | $-522.00K | $-2.04M | $-675.00K | $2.28M | $-706.00K | $-209.00K | $-613.00K | $4.34M | $-78.00K | $-2.11M | $122.00K |
| Other Non Cash Items | $1.45M | $21.00K | $21.00K | $22.00K | $-3.00K | $64.00K | $10.00K | $-16.00K | $-140.00K | $78.00K | $-148.00K | $12.00K | $-35.00K | $3.00K | $33.00K | $-23.00K | $-15.00K | $55.00K | $14.00K | $-51.00K | $-16.00K | $12.00K | $-40.00K | $-149.00K | $-180.00K | $71.00K | $29.00K | $-86.00K | $610.00K | $-59.00K | $102.00K | $2.14M | $619.00K | $-860.00K | $-27.00K | $-87.00K | $1.13M | $-225.00K | $60.00K |
| Net Cash Provided by Operating Activities | $-2.24M | $1.29M | $-3.77M | $-547.00K | $-2.03M | $-479.00K | $2.87M | $-668.00K | $832.00K | $-1.28M | $-2.45M | $-1.81M | $-225.00K | $-998.00K | $-1.78M | $-1.29M | $-85.00K | $-436.00K | $-946.00K | $-444.00K | $337.00K | $-522.00K | $-1.63M | $-375.00K | $-307.00K | $-1.06M | $-777.00K | $-3.01M | $754.00K | $-226.00K | $-793.00K | $2.13M | $2.52M | $-676.00K | $5.63M | $-718.00K | $4.24M | $-2.50M | $13.30M |
| Investments in Property Plant and Equipment | $-12.00K | $-22.00K | $-35.00K | $-50.00K | $- | $- | $- | $- | $- | $-2.00K | $- | $- | $- | $- | $- | $- | $- | $- | $- | $- | $- | $- | $- | $- | $4.00K | $- | $- | $-4.00K | $5.00K | $-2.00K | $- | $-3.00K | $- | $- | $- | $- | $- | $-10.00K | $- |
| Acquisitions Net | $- | $- | $- | $- | $- | $- | $- | $- | $- | $- | $- | $- | $2.00K | $- | $- | $- | $- | $- | $- | $- | $- | $- | $- | $- | $- | $- | $- | $- | $- | $- | $- | $- | $- | $- | $- | $- | $- | $- | $- |
| Purchases of Investments | $- | $-18.50M | $- | $- | $- | $- | $- | $- | $-984.00K | $- | $- | $984.00K | $-25.05M | $- | $- | $- | $-137.00K | $- | $-1.23M | $-213.00K | $-28.37M | $-13.03M | $-14.00M | $-1.08M | $- | $-22.06M | $- | $- | $- | $- | $- | $- | $- | $- | $- | $- | $- | $- | $- |
| Sales Maturities of Investments | $18.50M | $- | $- | $- | $- | $- | $- | $- | $- | $- | $24.06M | $984.00K | $-28.10M | $25.00M | $2.20M | $903.00K | $-1.85M | $1.85M | $- | $- | $14.03M | $14.00M | $- | $- | $67.29M | $942.00K | $-23.09M | $25.00M | $- | $2.79M | $-2.91M | $10.00M | $- | $- | $- | $- | $- | $- | $- |
| Other Investing Activities | $- | $-18.50M | $- | $- | $- | $- | $- | $- | $-24.06M | $-2.00K | $24.06M | $984.00K | $-25.04M | $25.00M | $2.20M | $903.00K | $-137.00K | $1.85M | $-1.23M | $-213.00K | $-1.00K | $975.00K | $16.08M | $1.00K | $-61.06M | $942.00K | $-23.09M | $25.00M | $-14.81M | $2.79M | $-2.91M | $10.50M | $-41.00K | $-10.03M | $5.01M | $-15.10M | $15.03M | $-33.00K | $-15.43M |
| Net Cash Used for Investing Activities | $18.49M | $-18.53M | $-35.00K | $-50.00K | $- | $- | $- | $- | $-25.04M | $-2.00K | $24.06M | $984.00K | $-25.04M | $25.00M | $2.20M | $903.00K | $-137.00K | $1.85M | $-1.23M | $-213.00K | $-14.34M | $975.00K | $2.08M | $-1.08M | $6.23M | $942.00K | $-23.09M | $24.99M | $-14.81M | $2.79M | $-2.91M | $10.50M | $-41.00K | $-10.03M | $5.01M | $-15.10M | $15.03M | $-43.00K | $-15.43M |
| Debt Repayment | $-1.00K | $- | $- | $- | $- | $- | $- | $- | $- | $- | $- | $- | $- | $- | $- | $- | $- | $- | $- | $- | $- | $- | $- | $- | $- | $- | $- | $- | $- | $- | $- | $- | $- | $- | $- | $- | $- | $- | $- |
| Common Stock Issued | $- | $- | $- | $- | $- | $- | $- | $- | $- | $- | $- | $- | $- | $- | $- | $- | $- | $- | $- | $- | $- | $- | $- | $- | $- | $- | $- | $- | $- | $- | $- | $- | $- | $- | $- | $- | $- | $- | $- |
| Common Stock Repurchased | $- | $- | $- | $- | $- | $- | $- | $- | $- | $- | $- | $- | $- | $- | $- | $- | $- | $- | $- | $- | $-7.00K | $-1.88M | $-347.00K | $-380.00K | $-1.65M | $-992.00K | $-3.63M | $-26.00K | $-48.00K | $-18.00K | $- | $- | $- | $- | $- | $- | $- | $- | $- |
| Dividends Paid | $- | $- | $- | $- | $- | $- | $- | $- | $- | $- | $- | $- | $- | $- | $- | $- | $- | $- | $- | $- | $- | $- | $- | $- | $- | $- | $- | $- | $- | $- | $- | $- | $- | $- | $- | $- | $- | $- | $- |
| Other Financing Activities | $- | $- | $- | $- | $- | $- | $- | $- | $- | $- | $- | $- | $-204.00K | $- | $- | $204.00K | $- | $- | $- | $- | $- | $- | $- | $- | $- | $- | $- | $- | $- | $- | $- | $- | $- | $- | $- | $- | $- | $- | $-18.99M |
| Net Cash Used Provided by Financing Activities | $-1.00K | $- | $- | $- | $- | $- | $- | $- | $- | $- | $- | $- | $-204.00K | $- | $- | $204.00K | $- | $- | $- | $- | $-7.00K | $-1.88M | $-347.00K | $-380.00K | $-1.65M | $-992.00K | $-3.63M | $-26.00K | $-48.00K | $-18.00K | $- | $- | $- | $- | $- | $- | $- | $- | $-18.99M |
| Effect of Forex Changes on Cash | $- | $- | $- | $- | $- | $- | $- | $- | $- | $- | $- | $- | $- | $- | $- | $- | $- | $- | $- | $- | $- | $- | $- | $- | $- | $- | $- | $- | $- | $- | $- | $- | $- | $- | $- | $- | $- | $- | $- |
| Net Change in Cash | $16.25M | $-17.23M | $-3.80M | $-597.00K | $-2.03M | $-479.00K | $2.87M | $-668.00K | $832.00K | $-1.28M | $21.61M | $-827.00K | $-25.27M | $24.00M | $418.00K | $-183.00K | $-222.00K | $1.41M | $-2.18M | $-657.00K | $-14.01M | $-1.43M | $102.00K | $-1.84M | $4.28M | $-1.11M | $-27.50M | $21.95M | $-14.10M | $2.55M | $-3.70M | $12.63M | $2.48M | $-10.70M | $10.65M | $-15.81M | $19.27M | $-2.55M | $-21.12M |
| Cash at End of Period | $19.89M | $3.64M | $20.87M | $24.67M | $25.27M | $27.29M | $27.77M | $24.91M | $25.58M | $24.74M | $26.02M | $4.42M | $5.25M | $30.51M | $6.51M | $6.09M | $6.28M | $6.50M | $5.08M | $7.26M | $7.92M | $21.93M | $23.36M | $23.26M | $25.10M | $20.82M | $21.93M | $49.42M | $27.47M | $41.57M | $39.02M | $42.73M | $30.10M | $27.61M | $38.32M | $27.67M | $43.48M | $24.21M | $26.76M |
| Cash at Beginning of Period | $3.64M | $20.87M | $24.67M | $25.27M | $27.29M | $27.77M | $24.91M | $25.58M | $24.74M | $26.02M | $4.42M | $5.25M | $30.51M | $6.51M | $6.09M | $6.28M | $6.50M | $5.08M | $7.26M | $7.92M | $21.93M | $23.36M | $23.26M | $25.10M | $20.82M | $21.93M | $49.42M | $27.47M | $41.57M | $39.02M | $42.73M | $30.10M | $27.61M | $38.32M | $27.67M | $43.48M | $24.21M | $26.76M | $47.87M |
| Operating Cash Flow | $-2.24M | $1.29M | $-3.77M | $-547.00K | $-2.03M | $-479.00K | $2.87M | $-668.00K | $832.00K | $-1.28M | $-2.45M | $-1.81M | $-225.00K | $-998.00K | $-1.78M | $-1.29M | $-85.00K | $-436.00K | $-946.00K | $-444.00K | $337.00K | $-522.00K | $-1.63M | $-375.00K | $-307.00K | $-1.06M | $-777.00K | $-3.01M | $754.00K | $-226.00K | $-793.00K | $2.13M | $2.52M | $-676.00K | $5.63M | $-718.00K | $4.24M | $-2.50M | $13.30M |
| Capital Expenditure | $-12.00K | $-22.00K | $-35.00K | $-50.00K | $- | $- | $- | $- | $- | $-2.00K | $- | $- | $- | $- | $- | $- | $- | $- | $- | $- | $- | $- | $- | $- | $4.00K | $- | $- | $-4.00K | $5.00K | $-2.00K | $- | $-3.00K | $- | $- | $- | $- | $- | $-10.00K | $- |
| Free Cash Flow | $-2.25M | $1.27M | $-3.80M | $-597.00K | $-2.03M | $-479.00K | $2.87M | $-668.00K | $832.00K | $-1.28M | $-2.45M | $-1.81M | $-225.00K | $-998.00K | $-1.78M | $-1.29M | $-85.00K | $-436.00K | $-946.00K | $-444.00K | $337.00K | $-522.00K | $-1.63M | $-375.00K | $-303.00K | $-1.06M | $-777.00K | $-3.02M | $759.00K | $-228.00K | $-793.00K | $2.13M | $2.52M | $-676.00K | $5.63M | $-718.00K | $4.24M | $-2.51M | $13.30M |
Coming soon...
Dividend Yield
0.00%
Dividend Payout Ratio
0.00x
Dividend Paid & Capex Coverage Ratio
44.18x
Dividend History
| Dividend | Adjusted Dividend | Date | Record Date | Payment Date | Declaration Date |
|---|---|---|---|---|---|
| $0.7 | $0.7 | October 01, 2014 | September 12, 2014 | August 22, 2014 | |
| $0.7 | $0.7 | September 10, 2014 | September 12, 2014 | September 30, 2014 | |
| $1.1 | $1.1 | March 25, 2010 | March 15, 2010 | March 02, 2010 |
Key Metrics
Financial Ratios
| Price to Earnings Ratio | 15.38x |
|---|---|
| Price to Book Ratio | 0.45x |
| Current Ratio | 14.49x |
| Quick Ratio | 10.78x |
| Cash Ratio | 10.08x |
| Debt to Equity | 0.01x |
| Return on Invested Capital | -0.11x |
| Return on Equity | 0.03x |
| Return on Assets | 0.03x |
Key Metrics
| Enterprise Value | $-7.82M |
|---|---|
| Revenue Per Share | $0.43 |
| Net Income Per Share | $0.04 |
| Operating Cash Flow Per Share | $-0.25 |
| Free Cash Flow Per Share | $-0.26 |
| Cash Per Share | $0.95 |
| Gross Profit Margin | 0.17% |
| Operating Profit Margin | -0.37% |
| Net Profit Margin | 0.03% |
Financial Growth
| Revenue Growth | 0.26% |
|---|---|
| Gross Profit Growth | -0.26% |
| EPS Growth | 2.16% |
| EBIT Growth | -0.65% |
| Operating Income Growth | -0.65% |
| Revenue Growth | 0.26% |
| Net Income Growth | 2.16% |
| Dividend Per Share Growth | 0.00% |
| Free Cash Flow Growth | -16.46% |
Coming soon...
Data provided by IEX Cloud & Financial Modeling Prep
Disclaimer: The content of this website is not to be intended as investment advice. The material is provided for informational purposes only and does not constitute an offer to sell, a solicitation to buy, or a recommendation or endorsement for any security or strategy, nor does it constitute an offer to provide investment advisory or other services by MLQ. MLQ makes no guarantees regarding the accuracy and completeness of the information expressed in this website. See our full Terms of Service for more information.